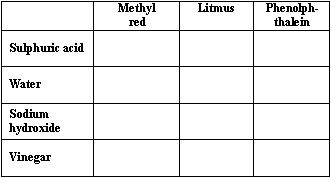
Recording results of a pH test

Recording results of a pH test

Pencil and paper
Overview
Using this Resource
Connecting to the Curriculum
Marking Student Responses
Further Resources
This task is about using indicators to find the pH of four different liquids.
Susie wanted to find out what happens when the indicator solutions of
  • methyl red,
  • litmus, and
  • phenolphthalein
were added in turn to each of
  • sulphuric acid,
  • water,
  • sodium hydroxide and
  • vinegar.
a)
Draw a table that Susie could use to record her results. (You do not need to show any results).


b)
Below is the pH scale.


pH scale from 0 to 14 showing 0 (bright red), 4 (yellow), 7 (green), 10 (blue) and 14 (purple)
 
 
When tested, vinegar turned the indicator orange, while lime water turned it dark blue.
Draw a V for vinegar and a L for lime water to show where these solutions would be on the pH scale.
Task administration: 
This task can be completed with pencil and paper.
Level:
5
Curriculum info: 
Description of task: 
Students draw up a table to illustrate results of how indicators change when placed into four different liquids.
Curriculum Links: 
Science capabilities
The capabilities focus is brought about by the conversations you have and the questions you ask.
Capability: Interpret representations
This resource provides opportunities for students to construct data tables for a set of data and to record where substances acidity locates them on a pH scale.
Answers/responses: 
  
Y10 (05/2003)
a) Draws up a table, e.g.,


All indicators and solutions are present in table headings (moderate). 
One indicator or solution missing (moderate).
easy

b)


A V and a L within the regions indicated below.

V correct - easy

L correct - easy