Sliding, spinning, tumbling

Sliding, spinning, tumbling

Pencil and paper
Overview
Using this Resource
Connecting to the Curriculum
Marking Student Responses
Working with Students
Further Resources

Di wants to see how a cube will travel when she flicks it with her pen.

Predict if the cube will tumble, slide, or spin when flicked in different spots.

a) i) Flicked in the centre (position 1)                      Tumble /  Slide / Spin   (circle one)
  ii) Explain your choice


b) i) Flicked in the centre (position 2)                      Tumble /  Slide / Spin   (circle one)
  ii) Explain your choice:


c) i) Flicked in the centre (position 3)                      Tumble /  Slide / Spin   (circle one)
  ii) Explain your choice:


d) i)
Which will travel further? (circle one)
 
(A) A cube flicked at the centre (position 1)
(B) A cube flicked at the left centre (position 3)
(C) Both will travel about the same distance
 
  ii) Explain your choice about which cube will travel furthest.


Plan
e)
What things must be done to conduct a fair test to decide whether a cube goes further spinning or sliding?


Data – Conduct an experiment
Test you predictions to c) by conducting an experiment. 
The teacher will demonstrate how to do this and how to record your data on your recording strip.
 
f) i)
Flick the cube in the centre (position 1). Mark the distance it goes on the upper line of your recording strip. Repeat this 20 times.
  ii)
Flick the cube in the left centre (position 3). Mark the distance it goes on the lower line of your recording strip. Repeat this 20 times.

 
Interpret your graphs
g)
 
Compare the results on the two recording strips to make a conclusion about whether the cube goes further when it is sliding, or when it is spinning.
 
  i)
Circle the response that best fits in this sentence:
My graph shows that a cube that is hit in position 1 usually travels _____________ than a cube hit in position 3.
further than   /  about the same distance as  / not as far as  (circle one)
 
  ii) Explain how you used the graphs to give you your answer to part i) above.


Pose other questions about flicking the cube
h) What other things could you test by flicking your cube?


Task administration: 
For each student:

  • One dice or wooden cube approx 1 cm3
  • One ball-point pen with clicking mechanism
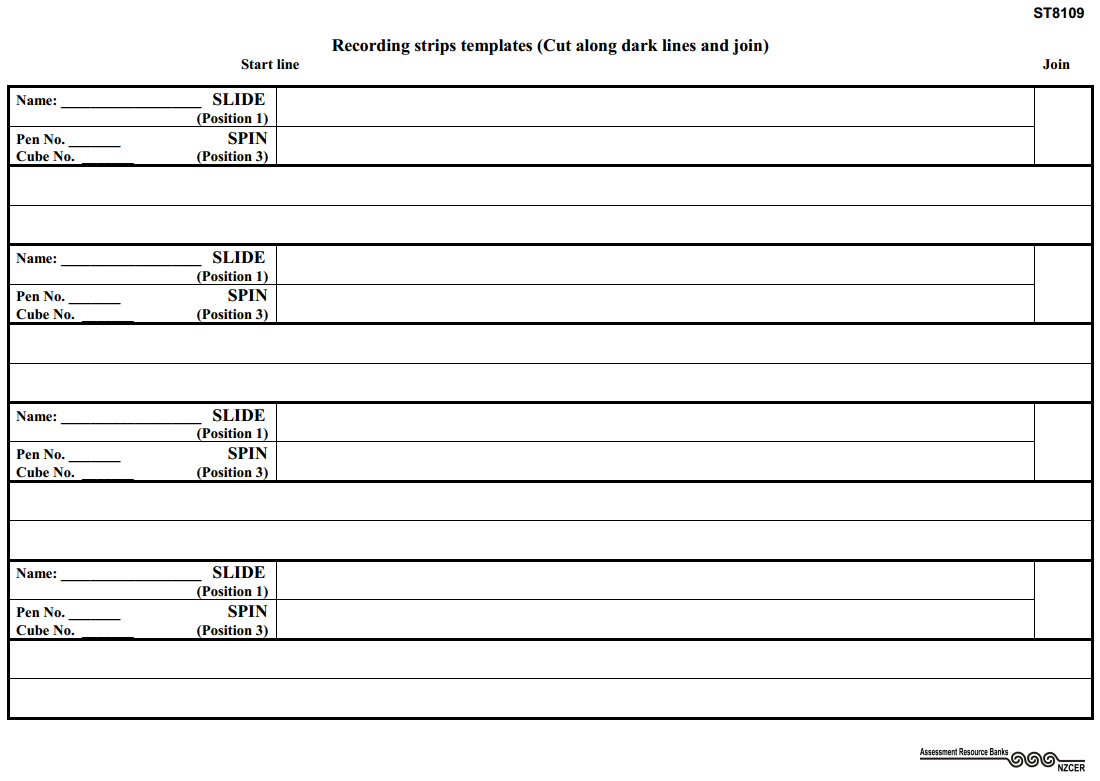
  • An answer sheet (first two pages) and a recording strip (see Recording strip template).
How to do this task:
  • Demonstrate how the cube (or dice) can slide, tumble, or spin depending on where it is flicked with the ball-point pen. Do NOT let the students see how you flicked it (cup the other hand over the cube). 
  • Get the students to do their predictions a) – c), and planning d) on their answer sheet.
  • Discuss their ideas on how to conduct a fair test. Start the cube in the same place, flick it on the same position, flick it the same way.
  • Model how to record the data using the recording templates.
  • Get students to flick with their left hands. This means the distance is larger in the usual left-to-right convention of the number line.
  • Hand out the equipment. Get the students to do a few practice flicks. Encourage them to the try and repeat the experiment quickly.
  • Observe how the students conduct their experiment, guiding them to conduct fair tests.
Using the recording strip template
  1. Cut out both pieces of the template and join them together. A small piece of double sided adhesive tape works well in the box under the word “join”).
  2. Write your name and the equipment you are using in the description box (or even on the reverse side).
  3. Flick the cube a little below the template strip in line with the Start line” and record the distance it travelled with a dot. If the cube slides further than the length of your strip, use more strips stapled or glued together.
    strip1.png
  4. Flick the cube a total of 20 (or more) times, always starting it in the same position and flicking in an identical way.
    strip2.png
  5. Flick the cube 20 (or more) times in Position 3 to make it spin. Record the results in the lower  strip. Look to see if one set of points is consistently longer than the other.
    strip3.png
  6. The graph in Part 5 can easily be turned into a box-and-whisker graph (box plot). This helps  interpret the graph. 
    Draw vertical lines at the median, and lower and upper quartiles. Join these to make a "box". Draw two horizontal lines ("whiskers") from the quartiles to the maximum and minimum point. Only allow the whiskers to be no longer than 1.5 times the length of the box. Other points can be marked as an asterix, as something unusual may have happened (we call these points “outliers”).
    strip4.png
  • Notice how it is easier to see which set of points indicates a longer distance. The median of the spinning cube is smaller than the lower quartile of the sliding cube. This indicates a sliding cube generally travels further than a spinning one.
  • Notice also that there are exactly the same number of dots in each quartile (5 in this case). This always happens when the sample size is a multiple of 4.
recording_strip_template.png
Level:
4
Description of task: 
Students predict how a cube will travel when flicked in different positions, and conduct an experiment to see what happens in practice.
Curriculum Links: 
This task provides evidence that the following judgements of student achievement levels are reasonable:
 
Plan a statistical investigation
Type of student responses Suggested curriculum level
Names three or more things that must be done to conduct a fair test.  At curriculum level 4 or above (Year 8 or above). 
Names two things that must be done to conduct a fair test. Early curriculum level 4 (Year 7). 
Names one thing that must be done to conduct a fair test.  Below curriculum level 4
 
Collect data
Type of student responses Suggested curriculum level
Plots all data points for both spinning and sliding correctly distinguishing points that are close together when appropriate. At curriculum level 4 or above (Year 8 or above). 
Plots most data points for both spinning and sliding correctly. Early curriculum level 4 (Year 7). 
 
Analyse and make conclusions
Type of student responses Suggested curriculum level
Appropriately identifies that the distributions are similar or different, and explains their reasons clearly.  At curriculum level 4 or above (Year 8 or above). 
Appropriately identifies that the distributions are similar or different, and attempts to justify their reasons.  Early curriculum level 4 (Year 7). 
Identifies specific individual features of the distributions. Below curriculum level (Year 6 or below). 
 
Key competencies
This resource involves:
  • Predicting outcomes of an experiment, exploring patterns and relationships in data and dealing with uncertainty, which relate to the Key Competency: Thinking
  • Communicating the findings of an experiment, and explaining variation, which relate to the Key Competency:Using language, symbols and text
  • Working collaboratively and sharing their work with other students, which relates to the Key Competencies: Relating to Others and Participating and Contributing
 
Links to science ideas
  • This resource asks students to conduct fair testing, which relates primarily to Investigating in science
  • Click on the link fair testing for other investigations.
  • Use the keywords or click on the links forces AND friction or centre of gravity to find resources with similar concepts. These concepts relate to the Physical World contextual strand.
Further science investigations
Many other experiments can be performed with the same equipment. A few of these follow:
  • Test the different ways in which the pen is flicked (e.g. with fingernail or with ball of finger);
  • Observe the path of the spinning cube (angle to direction of force / non-linear path);
  • Use different sized cubes with a constant force;
  • Record the distance travelled on different surfaces (i.e. with different levels of friction); or
Two of these could then be combined, for example different sized cubes on different surfaces. 
Further opportunities for statistical assessment or teaching
  • Creating dot plots (click on the link).
  • Creating box plots (box-and-whisker graphs) (click on the link). This is very intuitive if the number of points is divisible by 4, as a quarter of the points lie in each quartile.
  • Informally comparing box plots
    Students should be encouraged to decide when the two sets of points are far enough apart to indicate that the two sets are different. This can be assisted with a box-and whisker graph. This is very easy to do when the number of data points is divisible by four, when exactly a quarter of the data points lie in each quartile. A useful rule of thumb is that the sets are different when the medians are more than the inter-quartile range apart, e.g.:
    interquartile_range.png
  • Comparing variation 
    Students should be encouraged to decide if one set of results is more variable that the other, e.g., 
    The spinning cubes varied a lot more than the sliding ones. 
    They both varied lots in distance.
  • Identifying dependent variables 
    In this case, the dependent variable is the distance the cube travels. This depends on the pen or cube used, the surface it is on, etc. (the independent variables)
Answers/responses: 
a) i) - ii) Slide and a reasonable explanation [accept spin or tumble if a reasonable explanation is given]. The force (push) is right through the middle of the cube so it will not rotate. 

  • Because all you are doing is pushing it. 
  • If you push it, it will go straight like pool [the game]. 
  • Because it is in the centre and [the force] will be even. 
b) i) - ii) Tumble and a reasonable explanation [accept spin or tumble if a reasonable explanation is given]. 

  • The force (push) is at the top, so the cube will try and rotate (vertically). 
  • It is hit at the top so it will tumble forward causing more tumbling to occur. 
  • It is forcing the top of the cube so there is an uneven balance causing it to tumble.
c) i) - ii) Spin and a reasonable explanation [accept slide or tumble if a reasonable explanation is given]. 

  • The force (push) is on the side so it will rotate (horizontally). 
  • It will spin around in the direction of the hit. 
  • It will move to that side and keep on going. 
  • There is more weight (sic) pushing on that side causing it to spin to the left. 
d) i) - ii) A, and a reasonable explanation given. Because there is more friction when the cube is spinning as well as travelling forwards 
or 
Some of the force is taken up with spinning the cube rather than pushing it forwards. 

  • Spinning will slow it down. 
  • Because the spinning slows it. 
  • Because the cube only has to move forward so is not losing momentum spinning.
e)   Any 1 or more of:

  • Starting the cube from the same position; 
  • Pointing the cube and flicking in the same direction; 
  • Flicking the ball-point pen the same way, and the same distance away from the cube (preferably touching it); 
  • Using the same cube, ball-point pen or cube; 
  • Repeating it several times; 
  • Using the same kind of surface; 
  • Measuring it consistently; 
  • Any other reasonable suggestions. 

Students who can suggest three or more different criteria are performing at a higher level.

f)   Accurately records 20 dots for when the cube is sliding, and 20 when it is spinning.
g) i) - ii) A statement consistent with the two sets of points that the student has on their recording strip. Statements based on the overall shape or spread of the points. 

  • The distance [the spinning cubes went] was around ¾ the distance [of the sliding ones]. 
  • The [distances] are close but further back [than the sliding ones]. 
  • They both varied lots, but [the spinning ones] went the shorter distances. 
  • Because [the sliding ones] were usually in front [of the spinning ones]. 
  • The spinning ones are around the middle and not as spread out. 
  • [The sliding ones] are all past half way with a few grouped together. 
  • Most of the sliding cubes went further than the spinning ones. 

Do not accept one that is solely based on the location of specific features of the dot plots such as maximum, minimum, range, mean, median or mode.

h)   Any 1 or more of: 

  • Using different ball-point pens to see which had the stronger flick; 
  • Using different surfaces to see which has less friction; 
  • Seeing if tumbling makes the cube travel further or not; 
  • Seeing how far above the centre spot the flick needs to take place to create tumbling rather than sliding; 
  • Seeing if there are different ways to flick the biro (e.g., with the fingernail or with the ball of the finger); 
  • Comparing the right hand with the left hand; 
  • Comparing different people flicking with the same cube and ball-point pen on the same surface; 
  • How far up an inclined slope a cube will travel when flicked. 
  • Other sensible tests. 

NOTE: Accept words such as pressure, weight, power, energy etc. that are not scientifically correct, but are sufficiently close to the idea of force.

Teaching and learning: 
  • This resource incorporates Statistical investigations in a science context. It uses the Predict, Observe, Explain (POE) strategy. It also uses the statistical enquiry cycle (PPDAC: Pose - Plan – Data – Analyse – Conclusions – Communicate).
  • In statistics, the context of the investigation is vital. In this resource, the phenomenon under investigation is scientific. In particular it looks at forces and friction acting on a body (the cube or dice). Statistics is used to test the science ideas by conducting experiments.
  • The key statistical ideas are that an experiment must be repeated a number of times to build up a picture not just of the mean (average) of a measurement, but also of how much the measurements vary from each other (i.e., the variation that it involves). This variation can be shown through graphing the data and looking at the shape (distribution) of the data points.
Diagnostic and formative information: 
Statistical misconceptions
Common response 
Plotting data inaccurately 
Inaccurate or inconsistent plotting often because it is done by eye. 

Interprets individual features of graphs 
Examples: 
They both had about the same range. 
A sliding one went the furthest and a spinning one went the shortest. [i.e., focuses on just the  maximum or minimum values]. 
[The spinning cube] went the shortest distance once. 

States the cubes went about the same distance when the data indicated the distance varied.
Next steps: 
Plotting data inaccurately 
Students should be encouraged to plot data as accurately as possible. Using a ruler that is held perpendicular to the measuring strip can aid this. 
 
Interprets individual features of graphs 
Students need to look at the data holistically. They need to look at the overall pattern of the points. Looking at just the biggest or smallest value (or the range, which is the difference between these), is not sufficient and can sometimes be misleading. Ask the students, “Where are most of the points?” or “Put a circle around where most points lie.” 
 
States the cube went about the same distance when the data indicated the distance varied 
These students most likely expected the cube to go the same (or almost the same) distance when it is flicked in an identical way. They need to adapt their initial ideas when the data they collect provides evidence that contradicts their prediction. 
Mathematics resources 
For similar ARB resources see Sliding cubes
 
Science resources 
For similar ARB resources about forces and friction, see Rolling marbles II