Kick a ball

Kick a ball

Pencil and paperOnline interactive
Overview
Using this Resource
Connecting to the Curriculum
Marking Student Responses
Further Resources
This task is about interpreting a stem-and-leaf graph.

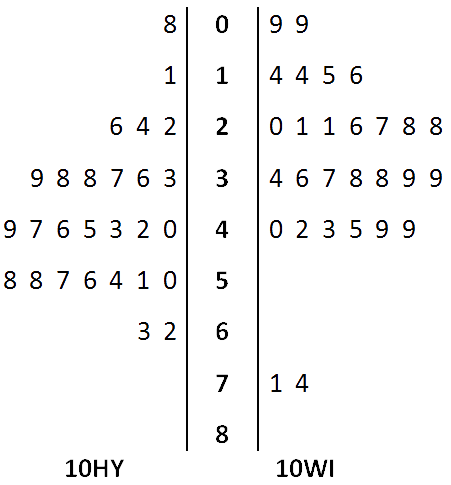
Two classes, 10HY and 10WI, had a rugby ball kicking competition. They measured their kicks to the nearest metre.

Here are their results shown on a back-to-back stem-and-leaf graph.  
Distance of kicks for 10HY and 10WI in metres
 
stem and leaf graph showing the distance of rugby kicks

Question 2Change answer

a)  i)  Which class were the best at kicking? 10HY10WI
     ii) How did you work out which class was best?

Question 2Change answer

b)  What was the median kicking distance for
i)   10HY?  m
ii)  10WI? m
Task administration: 
This task is completed with pencil and paper or online.
 
Levels:
4, 5
Description of task: 
Students interpret back-to-back stem-and-leaf graphs. Knowledge of the median is required.
Curriculum Links: 
This resource can be used to help to identify students' ability to interpret multivariate data displayed in a back-to-back stem-and-leaf graph.
Key competencies
This resource involves comparing distributions visually to identify patterns variations and relationships and explaining their rationale. These relate to the Key Competencies: Thinking and Using language, symbols and text.

For more information see http://https://nzcurriculum.tki.org.nz/Key-competencies
Learning Progression Frameworks
This resource can provide evidence of learning associated with within the Mathematics Learning Progressions Frameworks.
Read more about the Learning Progressions Frameworks.
Answers/responses: 
 

Y10 (2005)

a)

i)
ii)

10HY
Any 1 of:
 

  • Most 10HY students kicked 20 to 60 m, but most 10WI students only kicked 10 to 50 m.
  • The median distance for 10HY is higher.
  • 10HY's graph has a "higher bulge".
  • 10HY has more big kicks.
  • More in 10HY kick further.

[Answers will vary].

moderate
b)

i)
ii)

43
35

very difficult
very difficult