Temperatures across the region

Temperatures across the region

Pencil and paper
Overview
Using this Resource
Connecting to the Curriculum
Marking Student Responses
Further Resources
This task is about constructing a composite dot plot.
Temperatures in the lower North Island (N.I) of New Zealand (°C)
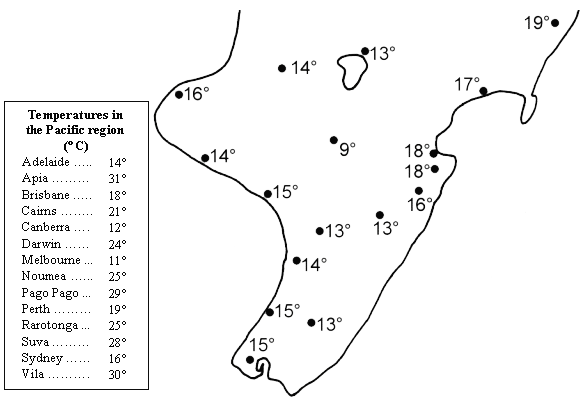
 
 
temperature map
 
 
A newspaper showed a weather map of temperatures in the lower North Island of New Zealand and a table of temperatures in the Pacific region. 
Use the map and the table to complete the composite dot plot below, of temperatures in the lower North Island and in the Pacific region.
The dot for Adelaide has been drawn in for you.
 
 
Composite dot plot of temperatures in the lower North Island (N.I) and Pacific region (°C)


empty-dot-plot
Task administration: 
This task is completed with pencil and paper only.
Levels:
4, 5
Description of task: 
Students complete a composite dot plot of temperatures using a weather map of the lower North Island.
Curriculum Links: 

This resource can be used to help to identify students' ability to construct a back-to-back dot plot.

Learning Progression Frameworks
This resource can provide evidence of learning associated with within the Mathematics Learning Progressions Frameworks.
Read more about the Learning Progressions Frameworks.
Answers/responses: 


Y11 (03/2001)

2 marks
(all Pacific region data correct)
or
1 mark
(1-2 errors in Pacific region data)

2 marks
(all NZ data correct)
or
1 mark
(1-2 errors in NZ data)

2 marks – very easy

1 mark – very easy


2 marks – easy

1 mark – very easy