Shooting hoops

Shooting hoops

Pencil and paper
Overview
Using this Resource
Connecting to the Curriculum
Marking Student Responses
Working with Students
Further Resources
This task is about interpreting data to make statements about the results.

Sixty students in two classes had ten shots each at a basketball hoop. Each shot was taken from the same position. 

The table shows their results.

table showing the number of successful hoops

 
a)
 
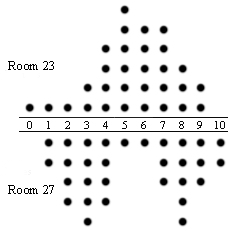
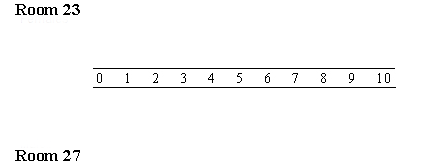
Draw a composite dot plot using the data in the table. The labels of the dot plot have been given.
 
 
Number of Successful Shots at a Basketball Hoop
 

set up for graph of hoop shooting
 
b)
What is the mode number of successful shots for Room 23? ____________
 
c) What is the range of the number of successful shots for the:
 
 
i) Room 23? ____________
 
ii) Room 27? ____________
 
d) Complete the following sentences.
 
 
i) Half of Room 23 got ___________  successful shots or fewer.
 
ii) Half of Room 27 got ____________  successful shots or fewer.
 
e)
From the dot plot make a statement comparing the shape of the graph for Room 23 with the shape of the graph for Room 27.


Task administration: 
This task is completed with pencil and paper only.
Level:
5
Description of task: 
Students construct a composite dot plot of shots at a basketball hoop by two classes. They identify the mode and range, and make statements about the results.
Learning Progression Frameworks
This resource can provide evidence of learning associated with within the Mathematics Learning Progressions Frameworks.
Read more about the Learning Progressions Frameworks.
Answers/responses: 
 

Y10 (10/1998)

a)  
Drawing a dot plot.
Data drawn correctly.

 
Number of Successful Shots at a Basketball Hoop

very easy
easy
b)   5 difficult
c) i)
ii)
9 or 0-9
9 or 1-10
very difficult (both correct)
d) i)
ii)
5
4
difficult (both correct)
e)   The graph for Room 23 has only one mode but
the graph for Room 27 has two modes (bimodal).
difficult
Diagnostic and formative information: 
  Common error Likely reason
a) Dot plot of frequencies of frequencies.
b) 1 Mode of frequencies in diagnostic a).
c) 6, 5 or 0-6, 0-5 Range of frequencies in diagnostic a).
d) 2, 2 or 2, 3 Uses frequencies in diagnostic a).