Three coin game I

Three coin game I

Pencil and paper
Overview
Using this Resource
Connecting to the Curriculum
Marking Student Responses
Further Resources
This task is about comparing theoretical with experimental outcomes.
Practical Task
Throw the three coins together. Score a "head" as 1 point and a "tail" as 2 points.
 
a) i) Add the three scores together, repeat this a total of 80 times and record your results in the tally chart below.
 
Sum of the three coins Tally
3  
4  
5  
6  
 
 
ii)
 
Complete the table below using the information from the tally chart above.
 
Sum of the three coins 3 4 5 6
Frequency        
 
b)
 
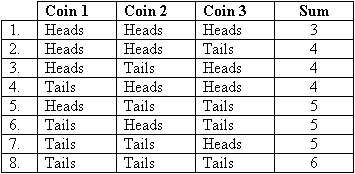
There are eight ways that the coins can come up. They are:


The probability of getting the three coins summing to 3 (i.e., three heads) is 18.
Complete the table of probabilities. The first one has been done for you.
 
Sum of the three coins (S) 3 4 5 6
Probability (p) 1/8      
 
c)
 
Use the table above to predict how many times you would expect to get each of the following sums if the three coins were thrown 80 times.
 
i)
ii)
iii)
iv)
A sum of 3?   __________
A sum of 4?   __________
A sum of 5?   __________
A sum of 6?   __________
 
Get your teacher to check parts b) and c) before you continue.


d) Write a statement comparing the expected frequencies in c) with what you actually got in the experiment in part a) ii).


e)
 
Why may the results in a) ii) and c) be different?
Give two reasons.
 
  •  


  •  


Task administration: 
This task is completed with pencil and paper, and other equipment.
 
[Equipment: Three coins per student (coins should be the same denomination).]
  • Students may work in pairs for part a) i) only.
  • Tell the students that in this activity a "head" scores 1 point and a "tail" scores 2 points.
Level:
5
Curriculum info: 
Description of task: 
Students throw three coins, and answer questions on frequency, probability, and compare theoretical with observed outcomes.
Curriculum Links: 
This resource can be used to help to identify students' understanding of predicting the results of a chance situation, and checking consistency between experimental and theoretical results (including models of all possible outcomes).
 
Key competencies
This resource involves predicting the outcome of a probability situation, and communicating the findings of the probability experiment, and explaining variation. These relate to the Key Competencies: Thinking, and Using language, symbols and text.

For more information see http://nzcurriculum.tki.org.nz/Key-competencies.

Learning Progression Frameworks
This resource can provide evidence of learning associated with within the Mathematics Learning Progressions Frameworks.
Read more about the Learning Progressions Frameworks.
Answers/responses: 


1 mark 
1 mark
a)
i) 
ii)
Tallies are kept systematically, (e.g., not ) with groupings of five.
All four frequencies correct based on table in a) i).
1 mark (for all 3 correct) b)  

Accept the table completed with any 1 of:

  • 3/8, 3/8, 1/8
  • 0×375, 0×375, 0×125
  • Other correct representations of these probabilities.
2 marks (for all 4 correct)
or
1 mark (for 2-3 correct)
c)
i)
ii)
iii)
iv)
10
30
30
10
2 marks
or
1 mark
d)  

General comparison, e.g., "My frequencies were close to the expected ones". Specific comparison, "I got eight 3's but I expected ten".

2 marks (for 2 correct)
or
1 mark (for 1 correct)
e)  
  • The theoretical distribution rarely follows the experimental (everyday life) because of random (chance) variation in the experiment, e.g., "The differences are just caused by luck", or "The expected frequencies are (exactly) based on probabilities but the observed ones can change".
  • One or more of the coins may be biased (unfair).
  • The way the coins are thrown is unfair, e.g., "Not flipped properly". NOTE: Accept "have a bigger sample size". (See note below.)

NOTE: With a bigger sample size the actual probabilities will get closer to the expected (theoretical) probabilities. However the probability that the expected frequencies exactly equal the actual frequencies is higher for smaller sample sizes.