

Throwing a ball

Throwing a ball

Auto-markingPencil and paperOnline interactive
Overview
Using this Resource
Connecting to the Curriculum
Marking Student Responses
Working with Students
Further Resources
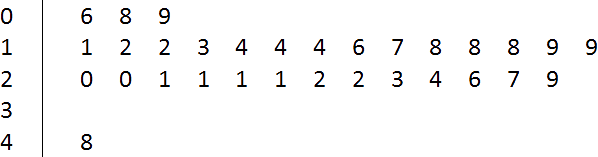
This task is about reading information from a stem-and-leaf graph.
All the students in Room 8 threw a netball as far as they could.
The distance each person threw the ball is shown in the stem-and-leaf graph below.
 
Distance the netball was thrown (metres)
 
stem-leaf-graph-netball-throws.png

Question 1Change answer

a)  What was the shortest distance the ball was thrown?  m

Question 1Change answer

b)  What was the most common distance the ball was thrown?  m

Question 1Change answer

c)  How many students threw the netball more than 21 metres, but less than 29 metres? 

Question 1Change answer

d)  How far was the longest throw?  m
Task administration: 
This task is completed with pencil and paper or online (WITH automarking).
Level:
3
Description of task: 
Students answer questions about a stem-and-leaf graph which shows the distances some students threw a netball.
Curriculum Links: 
This resource can be used to help to identify students' ability to interpret a stem-and-leaf graph.
Learning Progression Frameworks
This resource can provide evidence of learning associated with within the Mathematics Learning Progressions Frameworks.
Read more about the Learning Progressions Frameworks.
Answers/responses: 
 

Y6 (06/1998)

a) 6 difficult
b) 21 difficult
c) 6 difficult
d) 48 difficult
Diagnostic and formative information: 
  Common error Likely reason
a) 0
8
Smallest digit.
Digit at bottom of graph.
b) 1
8
9
Records most frequent digits.
c) 0 Saw all data as in range 0-9.
d) 9 Highest digit.