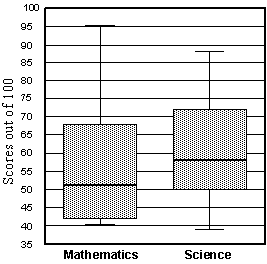
Exam results 0 Overview Using this Resource Connecting to the Curriculum Marking Student Responses Working with Students Further Resources This task asks questions about box-and-whisker graphs. This box-and-whisker plot shows the results of a class of 32 students who sat end-of-year examinations in mathematics and science. Examination Results in Mathematics and Science Question 1Change answer a) How many students scored 38 percent or below in science? Question 1Change answer b) i) Which subject has the higher median mark? ii) By how much higher is it? Question 2Change answer c) What is the range of marks for mathematics? Question 3Change answer d) What fraction of the class scored 50 percent or more in science? Task administration: This task is completed with pencil and paper and online with auto-marking. Level: 5 Curriculum info: Maths, Statistics, Statistical literacy Keywords: box-and-whisker graphs, graph interpretation, median, range Description of task: Students study a box-and-whisker graph of examination results for Maths and Science, and answer questions on comparison, median, range and proportion. Learning Progression FrameworksThis resource can provide evidence of learning associated with Statistical investigations, set 6 within the Mathematics Learning Progressions Frameworks.Read more about the Learning Progressions Frameworks. Answers/responses: Y10 (07/1998) a) 0 moderate b) i) ii) Science 7 marks [Accept 6-8 marks] easy c) 55 [Note: 40-95 is the spread] easy d) 3/4 difficult Diagnostic and formative information: Common error Likely reason b) ii) 12, 16, or 17 Miscalculates by 5 or 10 – scale reading error. c) 1 Reads bottom of whisker as 38. Community Fundraising Social studies test Auckland temperatures Geography test scores New graduate salaries Maths exam