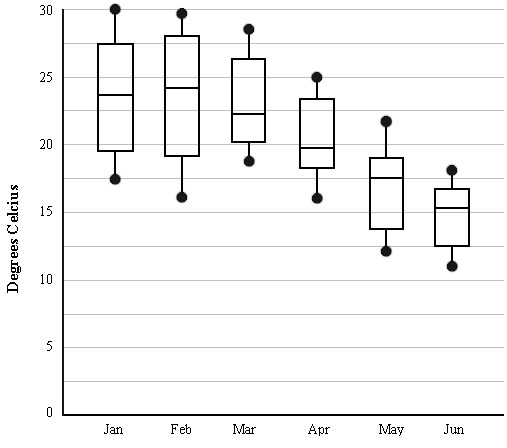
Auckland temperatures 0 Overview Using this Resource Connecting to the Curriculum Marking Student Responses Working with Students Further Resources This task is about interpreting a box-and-whisker graph. Maximum daily temperatures for Auckland Question a) Which month had the smallest range of maximum daily temperatures? January February March April May June Question 2Change answer b) What was the warmest temperature recorded over the six-month period? °C Question 2Change answer c) What was the coolest maximum daily temperature recorded over the six-month period? °C Question d) In which month was the median of the maximum daily temperatures the highest? January February March April May June Task administration: This task is completed with pencil and paper or online with auto-marking. Level: 5 Curriculum info: Maths, Statistics, Statistical investigations Keywords: box-and-whisker graphs, time-series, graph interpretation, range, median Description of task: Students interpret a box-and-whisker graph of maximum daily temperatures over time. Learning Progression FrameworksThis resource can provide evidence of learning associated with Statistical investigations, set 6 within the Mathematics Learning Progressions Frameworks.Read more about the Learning Progressions Frameworks. Answers/responses: Y10 (05/2000) a) June easy b) 30 easy c) 11 [Accept 11, 11.5, 12] moderate d) February moderate Diagnostic and formative information: Common error Likely reason b) c) 24 15.5, 16 Uses the median of each box-plot rather than the maximum or minimum. c) 12.5 Uses the lower quartile rather than the minimum. Exam results Community Fundraising Social studies test New graduate salaries Maths exam