Supermarket patterns

Supermarket patterns

Pencil and paper
Overview
Using this Resource
Connecting to the Curriculum
Marking Student Responses
Further Resources
This task is about plotting a graph from a chart.
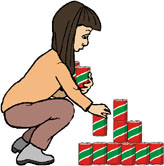
Abby is stacking baked bean cans for a supermarket display.
The table below shows the total number of cans she uses for stacks of different heights.
Height of stack 4 5 6 7 8 9 10 11 12
Total number of cans in the stack 1 3 6 10 15 21 28          
 
a)
 
Complete the table above to show the total number of cans in each stack.
 
b)
Describe the rule you used to complete the table.


c)
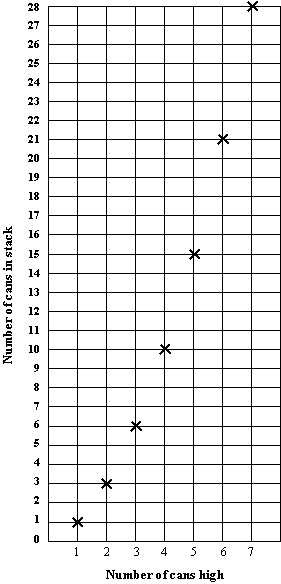
Use the information in a) to plot the points showing the total number of cans in each stack up to 7 cans high.
 
The relationship between the Number of cans used and the Height of each Stack
 
                         Number of cans high          
Task administration: 
This task is completed with pencil and paper only.
Level:
4
Description of task: 
Students identify and continue the number pattern for a stack of cans and complete a graph to demonstrate the relationship between two sets of numbers.
Learning Progression Frameworks
This resource can provide evidence of learning associated with within the Mathematics Learning Progressions Frameworks.
Read more about the Learning Progressions Frameworks.
Answers/responses: 
 

Y9 (02/2002)

a) 36, 45, 55, 66, 78
NOTE: Error may follow through from first answer, e.g., if 37 instead of 36 is used as the first answer and successive additions are correct, this is only 1 error.

all correct – easy

1 error – very easy

b) Accept any 1 of:

  • The total number of cans already in the stack + the number of cans high.
  • Add on the next consecutive number, i.e., + 1, 2, 3, 4, . . .
  • 1/2n (n+1) or other equivalent rules.

easy

c) Points plotted correctly. (See graph below).
NOTE: These marks are awarded regardless of an error in the type of graph drawn.
[Accept if consistent with answers to a)]

all correct – very easy

1 error – very easy

 
The relationship between the height of each stack and the number of cans used