Which graph matches the picture?
0
Overview
Using this Resource
Connecting to the Curriculum
Marking Student Responses
Working with Students
Further Resources
This task is about different ways of showing information.
Task administration:
This task can be completed online or with pencil and paper.
If students do the task on paper they could work in pairs to compare their ideas and interpretations of the graphs and decide together which graph best represents the data in the picture.
Copyright:
All images copyright to J.Fisher | PhotoKete are used with permission.
Levels:
1, 2
Curriculum info:
Key Competencies:
Keywords:
Description of task:
Task: Decide which of two graphs e.g., tally chart, pictograph, bar graph is represented by a picture and explain how the graph/s are interpreted.
Curriculum Links:
Science capabilities
The capabilities focus is brought about by the conversations students have and the questions they ask.
The capabilities focus is brought about by the conversations students have and the questions they ask.
Capability: Interpret Representations
Scientists represent their ideas in a variety of ways, including models, graphs, charts, diagrams, and written texts. This resource provides opportunities for students to: compare two different representations e.g., a picture and a graph; compare different types of graphs, e.g., tally charts, pictographs and bar graphs and; provide an acccurate explanation of how to read the representations/graphs.
Science capabilities:
Answers/responses:
| Questions | Correct responses |
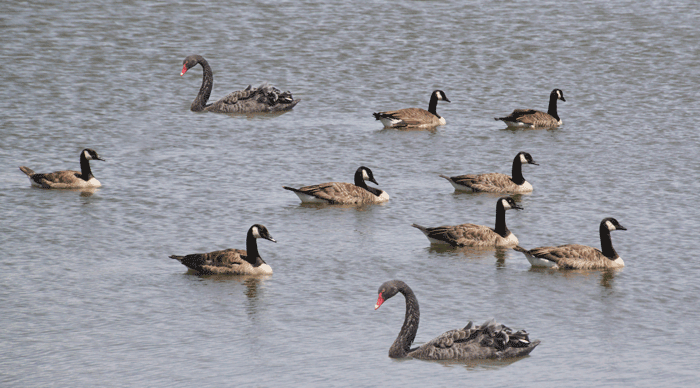
| a) Which tally chart shows the number of geese and swans in the picture? |
 |
| Why did you choose this? |
Any answer that clearly explains how the student has interpreted the graph, e.g.,
|
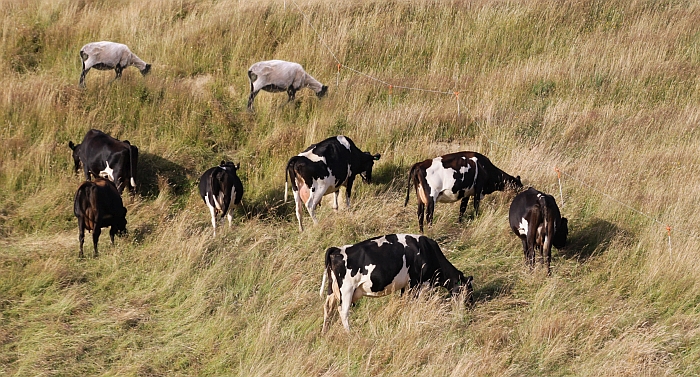
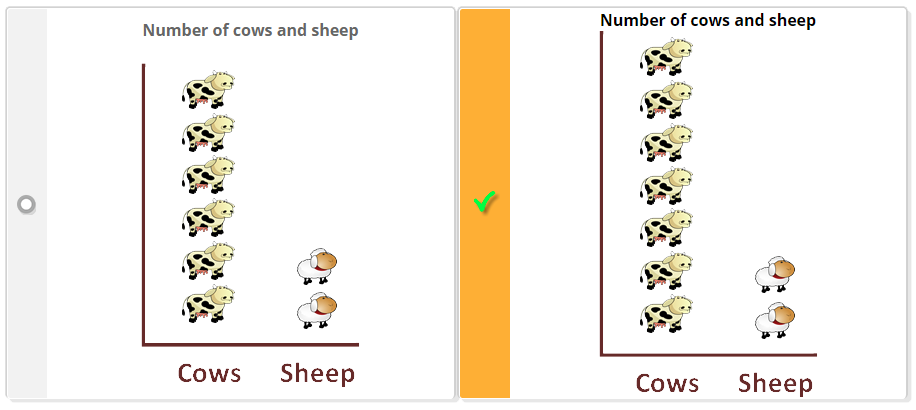
| b) Which of these pictographs shows the number of cows and sheep in the picture? |
 |
| Why did you choose this? |
Any answer that clearly explains how the student has interpreted the graph, e.g.
|
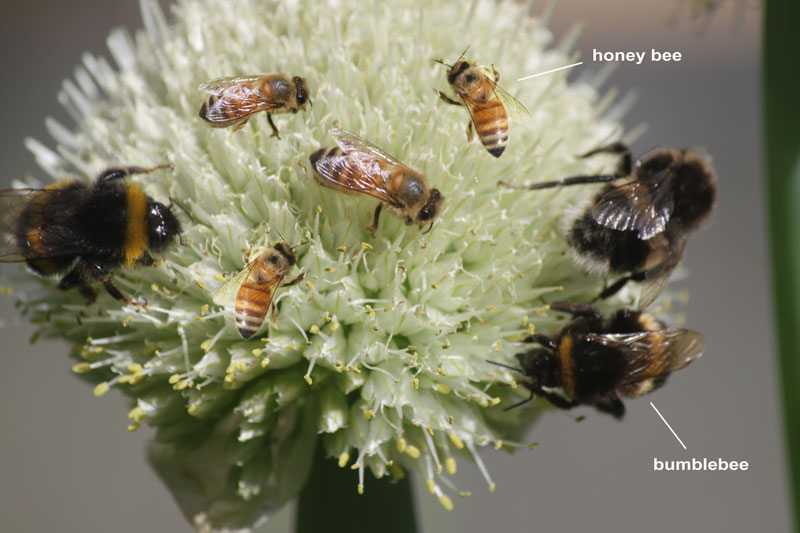
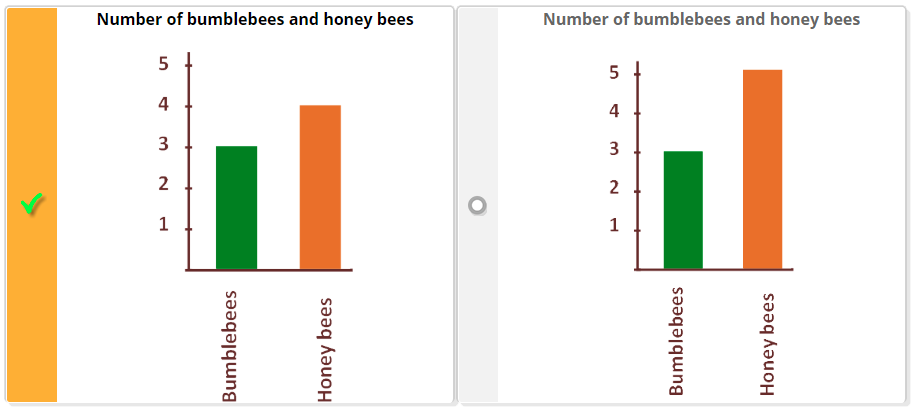
| c) Which of these bar graphs shows the number of bumblebees and honey bees in the picture? |
 |
| Why did you choose this? |
Any answer that clearly explains how the student has interpreted the graph, e.g.
|
Based on a sample of 47 Year 1 and 2 students completing the assessment online.
Teaching and learning:
The key ideas in this resource are about:
- noticing the similarities in two different types of representations, e.g., a picture and a graph
- noticing the differences between different types of graphs, e.g., tally charts, pictographs and bar graphs
- giving a clear explanation of how to interpret graphs.
Diagnostic and formative information:
| Questions | Student responses |
| a) Which tally chart shows the number of geese and swans in the picture? |
Three quarters of the students were able to identify the correct tally chart.
|
| Why did you choose this? |
Most of the students attempted to explain how they had interpreted the tally chart, e.g.,
However a quarter of the students gave a response that did not explain how it connected to the graph, e.g.,
|
| b) Which of these pictographs shows the number of cows and sheep in the picture? | Nearly all of the students were able to identify the correct pictograph. |
| Why did you choose this? |
Most of the students attempted to explain how they had interpreted the pictograph, e.g.
|
| c) Which of these bar graphs shows the number of bumblebees and honey bees in the picture? | Nearly all of the students were able to identify the correct bar graph. |
| Why did you choose this? |
Most of the students attempted to explain how they had interpreted the bar graph, e.g.
However some students gave a response that did not clearly explain how it connected to the graph, e.g.,
|
Next steps:
Capability: Interpret representations
It is important when interpreting representations that students think about how data is presented and ask questions such as what does this representation tell us? In this resource students compared two different representations, e.g., a picture and a graph and compared different types of graphs, e.g., tally charts, pictographs and bar graphs.
To help students to accurately interpret representations provide them with opportunities to share and discuss their ideas. Things they could look for:
- decide what the graph is telling them
- decide what parts of the graph to attend to, e.g., reading from the top of the bar to the y-axis
- compare different representations that contain the same information, e.g., a pictographs, bar graphs, tally charts
They could also discuss who might use each type of representation, e.g.,
- tally charts for people who are doing an investigation
- pictographs for someone who wants to illustrate some data and
- bar graphs for scientific reports.
Other Science resources about graphs at Level 1/2:

