Glasshouse temperature

Glasshouse temperature

Pencil and paper
Overview
Using this Resource
Connecting to the Curriculum
Marking Student Responses
Working with Students
Further Resources
This task is about graphing a linear equation.
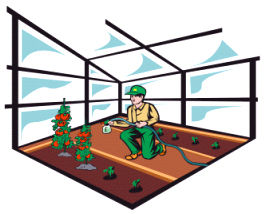
The temperature inside Hone's glasshouse, x, is always 3°C warmer than the temperature outside, y. This is shown by the relationship:


y = x - 3


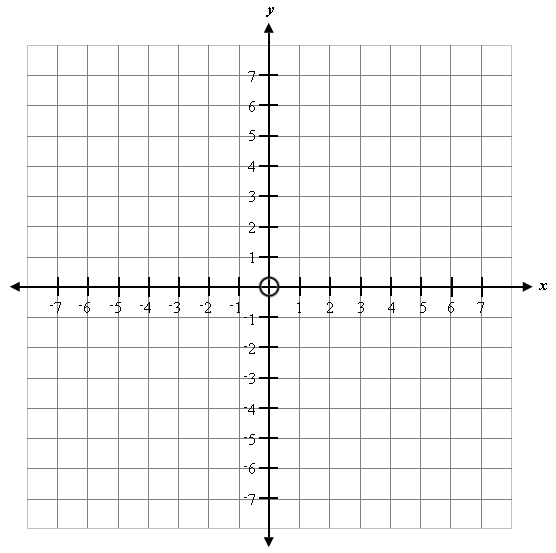
Graph this relationship on the axes below for values of  from -2°C to 5°C.
 

Task administration: 
This task is completed with pencil and paper only.
Level:
5
Description of task: 
Students are required to graph a linear relationship, within a range of x-values, as described by an equation in a practical context.
Learning Progression Frameworks
This resource can provide evidence of learning associated with within the Mathematics Learning Progressions Frameworks.
Read more about the Learning Progressions Frameworks.
Answers/responses: 
   

Y10 (11/2002)


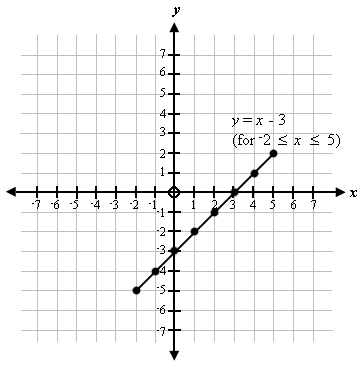
Line drawn with slope = 1 (or points plotted which have a slope = 1 if joined).
Line goes through (3,0), and (0,-3) (or plotted points are on line which would go through these intercepts).
Points plotted in the range -2 to 5.

moderate
difficult


difficult

Diagnostic and formative information: 

Student response

y-intercept (-6 1/2,0) with a correct x-intercept (3,0) and a slope = 13/6 .

Points plotted in the range -5 to -2.