School tests

School tests

Pencil and paper
Overview
Using this Resource
Connecting to the Curriculum
Marking Student Responses
Working with Students
This task is about identifying the mean, median, mode and range, and drawing a stem-and-leaf graph.

Ben recorded his friends' results in the end-of-term tests as percentages.

  
   Spelling Maths English Soc. Studies Science Health
Ben 90% 100% 80% 93% 91% 89%
Alex 100% 75% 80% 78% 94% 96%
Jo 69% 52% 90% 70% 83% 86%
Hiria 90% 100% 95% 85% 94% 100%
Hone 80% 85% 83% 85% 83% 96%
Rachel 75% 62% 70% 75% 53% 85%
 
a)
 
What is the mean percentage for English? __________%
 
b)
 
What is the mode for Health? __________%
 
c)
 
What is the median percentage for Maths? __________%
 
d)
 
What was Hone's mean percentage for the 6 results? __________%
 
e)
 
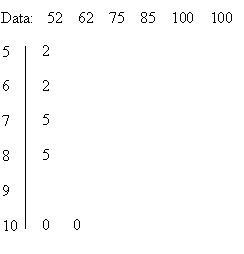
In the space below draw a stem and leaf graph for the subject with the greatest range.


Subject: __________


Task administration: 
This task is completed with pencil and paper only.
Levels:
4, 5
Description of task: 
Students study a table of test results percentages for a range of subjects. Students answer questions involving mean, median, mode and range. They also draw a stem-and-leaf graph.
Curriculum Links: 
This resource can be used to help to identify students' ability to interpret a table of data, including measures of centrality and spread, and construct a stem-and-leaf graph.
Learning Progression Frameworks
This resource can provide evidence of learning associated with within the Mathematics Learning Progressions Frameworks.
Read more about the Learning Progressions Frameworks.
Answers/responses: 
  

Y7 (10/1996)

Y8 (10/1996)

a) 83% difficult moderate
b) 96% difficult difficult
c) 80% very difficult difficult
d) 85.3% [accept 85%] very difficult difficult
e) Maths identified as the subject with the greatest range.
Stem and leaf graph for maths as below:

very difficult very difficult
Diagnostic and formative information: 
   

Common errors

Likely misconception

a)-d)


Confuses mean, median, mode, maximum, minimum, or total percentage.

c)

75, 85, 75-85

Has approximate understanding of median.

e)

Draws histogram or line graph.
Wrong subject

Doesn't understand range.