Soft drinks

Soft drinks

Pencil and paper
Overview
Using this Resource
Connecting to the Curriculum
Marking Student Responses
Working with Students
Further Resources
This task is about creating and reading information from a pie graph.

Every student in a Year 8 class was asked what their favourite drink was.

Here are the results.

Favourite drink Number of Students
Lemonade 6
Cola 8
Orange 4
Lime 3
Others 3
Total 24
 
a)
 
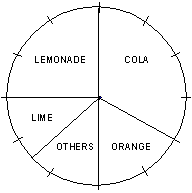
Complete and label the pie graph below to show these results.
 
 
Title: Favourite drinks


b) What fraction of the students liked Lemonade the best? ________

c)

What fraction of the students liked Lime or Orange the best?     ________
Task administration: 
This task is completed with pencil and paper only.
Level:
4
Description of task: 
Students construct and label a pie graph of favourite drinks from data in a table. They also interpret results involving proportions.
Curriculum Links: 
 
This resource can be used to help to identify students' ability to construct a pie graph from a table of data, recognising the fractions of the circle involved .
Learning Progression Frameworks
This resource can provide evidence of learning associated with within the Mathematics Learning Progressions Frameworks.
Read more about the Learning Progressions Frameworks.
Answers/responses: 
 

Y8 (05/1998)

a) Pie chart drawn, with segments given and labelled.

All 5 segments correct and labelled – moderate

2-4 segments correct and labelled – easy

b) 6/24 , 1/4 , 3/12 , 0.25, or 25% easy
c) 7/24 , 0.29, or 29% difficult
Diagnostic and formative information: 
  Common error Likely reason
b)
c)
6
7 (or 3)
Gives the number of drinks, rather than the fraction of drinks.
c) 1/3
3/24
Estimates rather than computes the fraction. 
Fraction who like Lime best.