TV favourites
This task is about creating a pie chart.

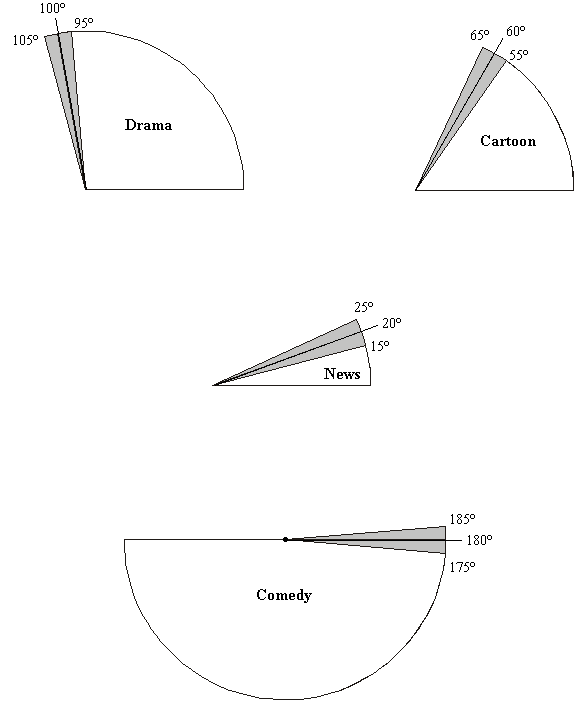
Emma asked 18 students their favourite type of TV programme. Here are her results.
|
Type of programme |
Frequency |
|
Cartoon |
3 |
|
Comedy |
9 |
|
Drama |
5 |
|
News |
1 |
|
TOTAL |
18 |
Draw Emma's results on a pie chart. The circle has been drawn for you and its centre is marked by the dot. You will need to use a protractor.


