Sunshine hours II

Sunshine hours II

Pencil and paper
Overview
Using this Resource
Connecting to the Curriculum
Marking Student Responses
Further Resources
This task is about constructing a bar graph.
The table below shows the number of sunshine hours each month, over a year, in four New Zealand towns.
 
a) Complete the last two columns in the table to show:

  • the total sunshine hours for Hokitika and Gore, and
  • each town's mean (average) monthly sunshine hours.
 
Monthly Sunshine Hours
 
  Jan Feb Mar Apr May Jun Jul Aug Sep Oct Nov Dec

Total

Mean

Kaitāia 207 210 195 190 185 160 150 160 180 190 200 205 2232 iii)  
Taupō 205 210 195 180 160 100 110 100 130 140 190 200 1920 iv)  
Hokitika 200 200 190 180 160 120 100 108 130 150 160 180 i)   v)   
Gore 195 190 180 170 100 90 75 90 100 110 160 190 ii)  vi)  

b)

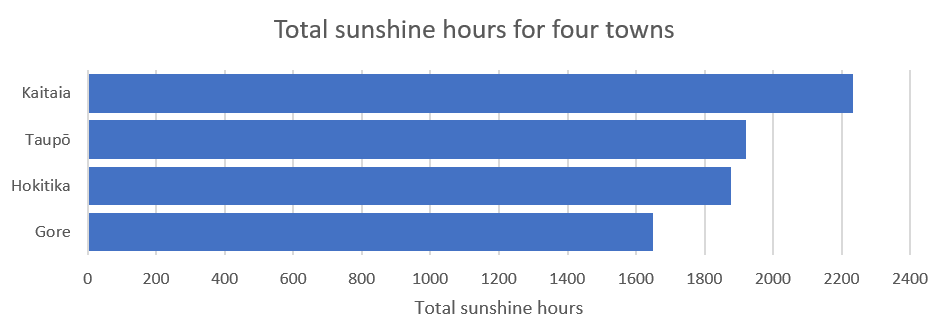
Complete a bar graph of Total Sunshine Hours for each town using the data in the table above.
 
 
Total Sunshine Hours

table of sunshine hours for towns

c)
 
Make a statement which compares the sunshine hours of any two towns.


Task administration: 
This task is completed with pencil and paper only.
Level:
4
Description of task: 
Students complete the total and mean columns in a table of sunshine hours. They then construct a bar graph and make a statement comparing some of the data.
Curriculum Links: 
This resource can be used to help to identify students' ability to compute means and construct bar graphs.
Learning Progression Frameworks
This resource can provide evidence of learning associated with within the Mathematics Learning Progressions Frameworks.
Read more about the Learning Progressions Frameworks.
Answers/responses: 
 
Y8 (07/1998)
a)

i)
ii)
 

iii)
iv)
v)
vi)

Total
1878 hours
1650 hours

Average/Mean
186 hours
160 hours
156.5 hours [Accept if answer a) i) ÷ 12]
137.5 hours [Accept if answer a) ii) ÷ 12]

moderate
 

all correct – moderate

2-3 correct – moderate

b)   Graph completed accurately based on answers in a).

bar graph of the total sunshine hours for four towns
NOTE: For bar graphs there should be a gap between the bars. 
moderate
c)   Answers will vary (accept if actual numerical difference based on answers given in part a)), e.g.,

•   Gore has less sunshine hours compared to Kaitāia.
•   Taupō is similar to Hokitika.

moderate