World softball scores

World softball scores

Pencil and paper
Overview
Using this Resource
Connecting to the Curriculum
Marking Student Responses
Further Resources
This task is about constructing a graph and making a general statement from the graph.

The New Zealand Men's Softball team won all their 14 games in the 2023 World Series.

The number of runs they scored in each game was as follows:


17,  4,  4,  6,  6,  8,  12,  13,  10,  5,  3,  3,  4,  4

 
a)
Use this data to complete the table below.
 
 
Runs Scored in a Game Number of Games

0-4 runs

5-9 runs

10-14 runs

15 or more runs


(i)    ____________

(ii)   ____________

(iii)  ____________

(iv)  ____________


b)
 
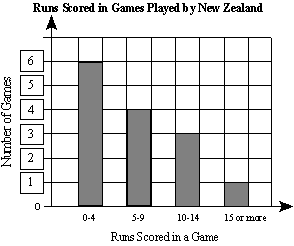
Complete the bar graph by using the data in the table above.
Write values in the boxes on the 'Number of Games' axis.


c)
Make a statement from the graph about the runs scored in games played by New Zealand.


Task administration: 
This task can be completed with pencil and paper.
Level:
4
Description of task: 
Students use raw data to construct a table and then a bar graph of the number of runs scored in softball games. Students are also required to make a statement about the results.
Curriculum Links: 
This resource can be used to help to identify students' ability to construct a frequency table, and construct and interpret a bar chart.
 
Key competencies
This resource involves exploring and using patterns and relationships in data and communicating findings. These relate to the Key Competencies: Thinking and Using language, symbols and text.
Learning Progression Frameworks
This resource can provide evidence of learning associated with within the Mathematics Learning Progressions Frameworks.
Read more about the Learning Progressions Frameworks.
Answers/responses: 
  

Y8 (07/1998)

a) i)
ii)
iii)
iv)
6
4
3
1
all correct - very easy
b)   y-axis correctly numbered: 1, 2, 3, 4, 5, 6 or other regular intervals.
Bars correctly drawn (based on their actual answers in a) above) and bars all having the same width.
NOTE: Allow mark if bars are touching.

easy

easy

c)   Any reasonable statement about the data such as:

  • Most common number of runs scored per game was 0-4.
  • Least games had 15 or more runs scored in them.
  • There were more low scoring games than high scoring games.
  • Scored an average of 7.07 runs per game.
  • NZ scored 0-9 runs most games.
  • NZ scored 99 runs in total.
  • NZ got at least 1 run each game they played.

NOTE: Do not accept statements that just report the data from a).

moderate