Teenagers time for tasks

Teenagers time for tasks

Pencil and paper
Overview
Using this Resource
Connecting to the Curriculum
Marking Student Responses
Working with Students
Further Resources
This task is about plotting a composite bar graph.
How do New Zealander's aged 13-18 spend their time?
 
Main Activity for people aged 13-18 years – Average Minutes per day
Gender
Household Work
Social Entertainment
Sports and Hobbies
Mass Media and Free Time Activities
Female
57
143
59
148
Male
33
106
129
155
 
Statistics New Zealand and the Ministry of Women's Affairs carried out a Time-use survey to find out what activities people spend their time on. 
The table above shows some of their results.
 
a) Draw a composite bar graph on the grid below using the data from the table.


b)
Write two statements comparing the activities of females and males in the survey.
 
 
1.


2.


Task administration: 
This task is completed with pencil and paper only.
Levels:
4, 5
Description of task: 
Students are required to construct a composite bar graph based on Statistics New Zealand Time Use Survey data and are then required to make comparative statements based on gender.
Curriculum Links: 
This resource can be used to help to identify students' ability to construct and interpret a composite bar graph.
 
Key competencies
This resource involves comparing distributions visually to identify patterns variations and relationships and explaining their rationale. These relate to the Key Competencies: Thinking and Using language, symbols and text.
Learning Progression Frameworks
This resource can provide evidence of learning associated with within the Mathematics Learning Progressions Frameworks.
Read more about the Learning Progressions Frameworks.
Answers/responses: 


Y8 (11/2002)

2 marks
(all bars correct
height)
or
1 mark
(1-2 errors in bar
heights)


2 marks
or
1 mark
 
 
1 mark
1 mark
 
1 mark
 
1 mark
1 mark 
a)
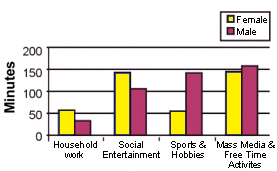
Example of composite bar graph drawn.

Main Activity for people aged 13-18 years

         *Main Activity (optional)

Draws a composite bar graph with spaces between each
activity.
Draws a composite bar graph with no spaces or uneven
spaces between each activity.
x-axis
•   bars are of equal width.
•   used fully to display data.
y-axis
•   appropriately scaled using even intervals (accept is 0
     is missing).
•   used fully to display data.
Title present, and both axes are appropriately labelled.
NOTE: If the bar heights for males and females are
transposed count this as one error for each transposition.

easy


very easy


easy
 
very easy
 
 
very easy
very easy
 
easy
 
very easy
moderate

2 marks
(for both correct)
or
1 mark
(for 1 correct)

b) Gives statement comparing the activities of females and males based on the data in the table or the graph drawn. e.g., females spent about half as much time on sports and hobbies that males do.

easy
 
 
very easy

Diagnostic and formative information: 
 

Common error

a)

y-axis not labelled - 35%.
Title not given - 28%.

b)

Makes statement that do not compare males and females.