Water temperature

Water temperature

Pencil and paper
Overview
Using this Resource
Connecting to the Curriculum
Marking Student Responses
Further Resources
This task is about collecting and showing data on a graph.

a) •   
Your teacher will give you a thermometer and a container with hot water in it.
Let this sit for 1 minute to allow the temperature to stabilise.
  •    Now record the temperature of the water and write this temperature in the table below at 0 minutes.
  •    Keeping the thermometer in the water, record the temperature changes at 1-minute intervals over ten minutes.
   

Time (minutes)

Water Temperature (°C)

0


1


2


3


4


5


6


7


8


9


10


b)
 
On the grid below draw a graph to show your results over the 10 minute period. You will need to complete the x- and y- axes.
 
 
Temperature change of water each minute over 10 minutes


Task administration: 
This task is completed with pencil and paper only.

Equipment:

Hot water (approximately 60°C); containers to put water in; stopwatch or clock with seconds hand; thermometer (one for each container).

  • The data collection part of this task could be carried out individually or in small groups.
  • Prior to doing this task check that students can accurately read a thermometer scale.
  • You may wish to do this activity yourself before giving it to your students to get an estimate of expected results.
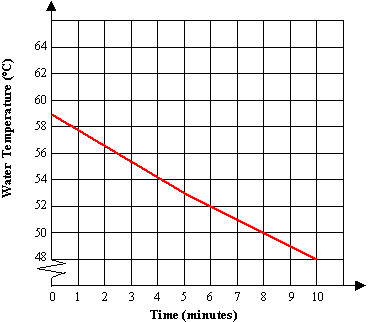
  • The scoring guide attached gives a graph of expected results if 100 mLs of water in an arcoroc cup (at a starting temperature of 61°C) is measured at 1-minute intervals over 10 minutes.
Level:
4
Description of task: 
For this practical task students collect time-series data on the change in water temperature in a container at regular time intervals. Students are also required to display their results on an appropriate graph.
Curriculum Links: 
This resource can be used to help to identify students' ability to measure and record data and display it with a line graph.
Learning Progression Frameworks
This resource can provide evidence of learning associated with within the Mathematics Learning Progressions Frameworks.
Read more about the Learning Progressions Frameworks.
Answers/responses: 


a)

Temperatures recorded every minute.
Temperatures read accurately. This can be checked against data teacher has collected or the graph below (if collected under the stated conditions).

b)

The graph drawn is a line graph.

Temperature change of water each minute over 10 minutes

Remaining marks can still be given even if alternative graphs have been drawn.
Time is on the x-axis and temperature is on the y-axis.
All points plotted accurately from data collected in a).

1-2 plotting errors, including omissions.
y-axis evenly scaled.
y-axis appropriately scaled, e.g., for the above example values in the range 40 to 70.
NOTE: It is optional to use the markings on the y-axis.
x-axis has 1-minute intervals clearly marked, including the 0 point.
Labelling complete and appropriate for x- axis and y-axis.