Typing rates

Typing rates

Pencil and paper
Overview
Using this Resource
Connecting to the Curriculum
Marking Student Responses
This task is about creating a graph to show data over days of the week.

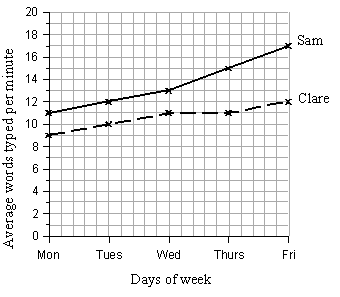
Sam and Clare are learning to type. The table shows the average number of words they typed per minute each day for a week:

   Monday Tuesday Wednesday Thursday Friday
Sam 11 12 13 15 17
Clare 9 10 11 11 12

Draw a graph on the grid below showing Sam and Clare's typing speeds over the week.


Task administration: 
This task is completed with pencil and paper only.
Level:
4
Description of task: 
Students are asked to construct and label a line graph of words typed per minute by two students for each day of the week. Data is provided in a frequency table.
Curriculum Links: 
 
This resource can be used to help to identify students' ability to construct line graphs (or bar graphs) for some time-series data.
Learning Progression Frameworks
This resource can provide evidence of learning associated with within the Mathematics Learning Progressions Frameworks.
Read more about the Learning Progressions Frameworks.
Answers/responses: 
   

Y9 (04/1999)

x-axis scale correctly constructed, labelled with Mon-Fri (even intervals). easy
y-axis scale correctly constructed, labelled with appropriate figures. very easy
Graph titled and y-axis titled (accept if x-axis not titled 'Days of week'). difficult
All points plotted correctly, joined and must be a line graph. Accept bar graphs. moderate
Key or labelling of the 2 lines. Accept bar graphs

Sam and Clare's Typing Speed

very easy