Homework times

Homework times

Pencil and paper
Overview
Using this Resource
Connecting to the Curriculum
Marking Student Responses
Working with Students
Further Resources
This task is about plotting data on a graph.
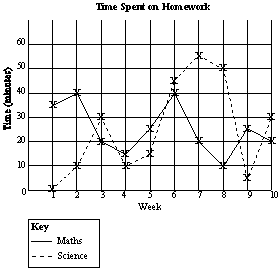
Below is the record Lagi kept of the time she spent on maths and science homework over 10 weeks.
 
  Week
1 2 3 4 5 6 7 8 9 10
Maths homework (minutes) 35 40 20 15 25 40 20 10 25 20
Science homework (minutes) 0 10 30 10 15 45 55 50 5 30
 
a)
 
Graph these results as a line graph below. Label the graph correctly.


b)
In which week did Lagi do the most homework?  
 
Week __________
 
c)
The largest time difference between maths and science was in which week? 
 
Week __________
 
d)
Make a general statement about the differences in Lagi's patterns of maths and science homework over the 10 weeks.


Task administration: 
This task is completed with pencil and paper only.
Levels:
4, 5
Description of task: 
Students construct and label a line graph of time spent on Maths and Science homework, and answer questions interpreting the data.
Curriculum Links: 
This resource can be used to help to identify students' ability to construct and interpret two time series graphs.
Learning Progression Frameworks
This resource can provide evidence of learning associated with within the Mathematics Learning Progressions Frameworks.
Read more about the Learning Progressions Frameworks.
Answers/responses: 
  

Y10 (10/1998)

a) All points plotted accurately.
Title, x, and y axes labelled.
Appropriately numbered scales for axes.
Clear key given.

easy
moderate
very easy
very easy
b) 6 very easy
c) 8 easy
d) Science varied a lot more than maths (had a bigger range). 
NOTE: Other correct statements are possible.
very difficult


Diagnostic and formative information: 
  Common error Likely reason
b) 7 Week where most homework done in one subject.
c) 1, 7 Does not see week 8 has a difference that is bigger.