Women's international marathon

Women's international marathon

Pencil and paper
Overview
Using this Resource
Connecting to the Curriculum
Marking Student Responses
Working with Students
Further Resources
This task is about constructing a graph.

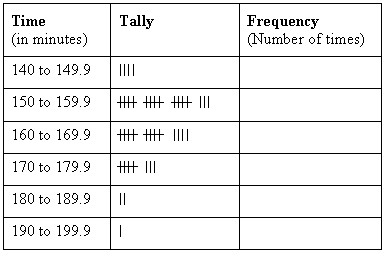
Running times for an international women's marathon

marathon-table.png

This is a tally chart of the times taken by the runners to run an international womens' marathon.


a)
Complete the frequency column in the table above.
 
b)
Draw a histogram on the grid below that displays these results.
Remember to complete the scales on each axis.
 

Times taken to run an international womens' marathon.


Frequency
 

Time (minutes)

Task administration: 
This task is completed with pencil and paper only.
Level:
4
Description of task: 
Students complete a tally chart to show the frequency of running times for a women's marathon. Students then present this information in a histogram.
Learning Progression Frameworks
This resource can provide evidence of learning associated with within the Mathematics Learning Progressions Frameworks.
Read more about the Learning Progressions Frameworks.
Answers/responses: 
  Y8 (03/2001)
a) 4, 18, 14, 8, 2, 1 very easy
b)
i)
ii)
iii)
iv)
See diagram below.
Histogram is correctly drawn with the bars touching.
x-axis has all categories correctly labelled (accept either way of labelling.)
y-axis is appropriately numbered (accept any systematic numbering up to 20 or if the 0 is omitted.)
very easy
very easy
easy
easy

Times taken to run an international womens' marathon.

Frequency  


or

         140-149.9

150-159.9

160-169.9

170-179.9

180-189.9

190-199.9

         140

150

160

170

180

190


Time (minutes)

Teaching and learning: 
 
This resource can be used to help to identify students' ability to construct a histogram.