Tulip heights

Tulip heights

Pencil and paper
Overview
Using this Resource
Connecting to the Curriculum
Marking Student Responses
Working with Students
Further Resources
This task is about constructing and interpreting a graph.

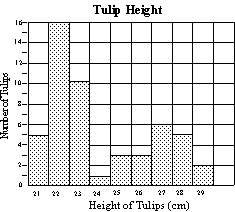
Mara measured the heights of the tulips in her garden to the nearest centimetre.

Below is Mara's data.  


Height (in cm) 21 22 23 24 25 26 27 28 29
Number of tulips 5 16 10 1 3 3 6 5 2


a)

Complete a histogram for the data and label the x-axis.
 
 
Tulip Heights


Using Mara's data, calculate each of the following statistics about the height of the tulips in her garden:
 
b)
 
c)
 
d)
 
e)
range __________ cm
 
mode __________ cm
 
median __________ cm
 
average (mean) __________ cm
Task administration: 

This task is completed with pencil and paper only.
 
Level:
5
Description of task: 
Students construct and label a histogram of tulip heights from data in a table. They also answer questions about range, mode, median and mean.
Learning Progression Frameworks
This resource can provide evidence of learning associated with within the Mathematics Learning Progressions Frameworks.
Read more about the Learning Progressions Frameworks.
Answers/responses: 
  

Y10 (07/1998)

a)
  • x-axis labelled
  • x-axis numbered correctly
  • Bars drawn correctly
 
 
moderate
very easy
easy
b) 8 (or 21-29) moderate
c) 22 difficult
d) 23 very difficult
e) 24 very difficult
Diagnostic and formative information: 
  Common error Likely calculation Likely reason
b) 15 16 - 1 Range of frequencies.
d) 25   Median of 21, 22, . . . 29.
e) 25 (21 + 22 + . . . + 29) ÷ 9 Mean of 21, 22, . . . 29.