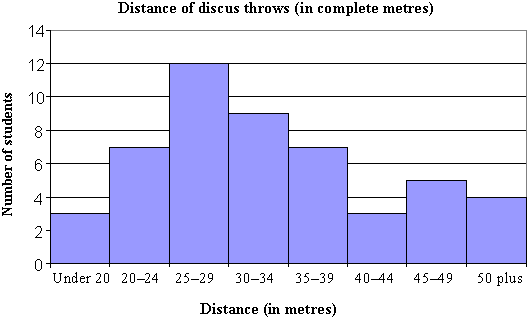
Discus results 0 Overview Using this Resource Connecting to the Curriculum Marking Student Responses Working with Students Further Resources This task is about reading information from a graph. At the school athletics day 50 students entered a discus throwing competition. The graph shows the length of their throws. Question 1Change answer a) How many students threw the discus a) How many students threw the discus i) less than 20 metres? ii) from 30 to 39 metres? Question 1Change answer b) What percentage of students threw the discus b) What percentage of students threw the discus i) 40 metres or more? % ii) from 20 to 29 metres? % Question 2Change answer c) Explain why you cannot tell from the graph the distance of the longest throw. c) Explain why you cannot tell from the graph the distance of the longest throw. Question 3Change answer d) What are two problems with the way this histogram has been set up? d) What are two problems with the way this histogram has been set up? 1. 2. Task administration: This task is completed with pencil and paper or online with some auto-marking. Levels: 4, 5 Curriculum info: Maths, Statistics, Statistical investigations Key Competencies: Using language, symbols, and texts Keywords: histograms, graph interpretation, percentages, misleading graphs Description of task: Students answer questions from a histogram of distance of discus throws. Calculation is required. Curriculum Links: This resource can be used to help to identify students' ability to interpret a histogram. Key competencies This resource involves explaining why a graph does not provide information about the maximum value. This relates to the Key Competency: Using language, symbols and text. Learning Progression FrameworksThis resource can provide evidence of learning associated with Statistical investigations, set 5Statistical investigations, set 6 within the Mathematics Learning Progressions Frameworks.Read more about the Learning Progressions Frameworks. Answers/responses: Y10 (06/2000) a) i) ii) 3 16 very easy - both correct b) i) ii) 24 38 moderate - 2 correct easy - 1 correct c) Any 1 of: because the data are grouped into intervals. because the last interval is open-ended. because it could be anything over 50. because individual distances or exact distances are not given. other similar explanations. very easy d) Any 2 of: the intervals should be even (i.e., even value). the first interval (20 and below) is much larger interval (20) than the following intervals (5). the last interval (50 plus) is much larger interval (?) than the preceding intervals. x-axis values should be numbers on a scale (continuous data), rather than intervals. gaps between the intervals: what happens if somebody throws a discus between the whole number intervals? e.g., 39.5 metres Diagnostic and formative information: Common error Likely calculations Likely reason b) i) ii) 6 9.5 12 ¸ 2 19 ¸ 2 Dividing by 2 instead of multiplying by 2. Tulip heights Vehicle speeds Showing data Women's international marathon