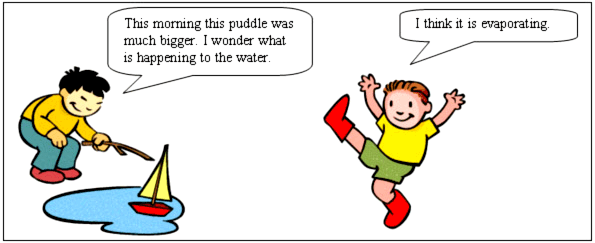
The disappearing puddle

- that labels clarify a diagram’s message.
- that scientists have agreed ways of representing things we cannot see (Levels 4 and 5).
|
Y4 (09/2007) |
Y10 (09/2007) |
|
|
1. No change identified/not enough information from picture to judge understanding.
|
25% | 7% |
| 2. Response focuses on what happens to the puddle rather than the water that disappears from the puddle e.g., the puddle gets smaller. | 35% | 16% |
| 3. Response indicates some understanding of water evaporating. | 25% | 67% |
| 4. Response indicates an explanation other than evaporation or uses wrong terminology e.g., the water soaks into the ground, the sun melts the puddle. | 15% | 2% |
|
5. No response.
|
8% |
NOTE: The table above shows how we categorised student responses in the trials. We have shown frequency of responses as percentages, rather than levels of difficulty, as the focus was not on whether answers were right or wrong, but on what sort of answers students gave. Only the bolded level of response indicated that students understood anything about evaporation. Responses within this category ranged from a beginning understanding that the water went into the air, to a sophisticated explanation of how the water particles behaved differently in different states. An understanding of the process of evaporation at a particle level is not expected in the curriculum before Level 4.
The intent of this task is to find out what students know about evaporation, and their level of understanding of the process. According to the new curriculum students should "begin to develop an understanding of the particle nature of matter and use this to explain observed changes" at Level 4. Not surprisingly, we found that only 3 students in the sample of 258 Year 4 students produced a response that showed understanding of evaporation at the particle level. By Year 10 though still only 19 students in the sample of 294 students showed understanding of evaporation at this "micro" level. Although the task did not explicitly ask the students to explain what was happening at the micro-level the inclusion of the image of a magnifying glass was intended to cue them in to this level of explanation.
Language of the task
One of the challenges of this resource is the language used in the task. We did not want to simply ask where the water went when a puddle dried up because we wanted the question to be open enough to allow students to show what actually happened to the water particles when the water evaporated if they had that "micro" level understanding of the process of evaporation.
However, about a third of the Year 4 students interpreted the question to mean what happened to the puddle rather than what happened to the water that disappeared from the puddle. This was less evident at Year 10, possibly because students at that age may be more "tuned in" to the likely questions asked in science. If you think the language used in this resource will not focus your students on the evaporated water you might like to change the wording to something like "Think about the water that goes away as the puddle gets smaller. If you could see what was happening to that water, what do you think you would see?" Note: If you do change the wording it is not valid to compare your students' results with those from the national trial.
Misconceptions about evaporation
Although we did not specifically look for the misconceptions about evaporating puddles, the range of misconceptions from the literature were apparent. Go to Salient points from the literature about understanding the water cycle.
Talking to students about their responses
In this task students were asked to represent their ideas pictorially. Lack of clarity of some drawings made it difficult to work out exactly what ideas students were trying to represent. Sixty percent of the 65 Year 4 students whose responses did not provide enough information for us to judge their understanding did not use any labels on their drawings. All the Year 4 students who showed they knew something about evaporation used labels. This illustrates the important role labels play when communicating ideas visually and if students do not know that, visual representations may not give students an opportunity to show what it is they actually know about the science. Talking to these students about their pictures would give a more valid assessment of their understanding of evaporation. This highlights the importance of being sure of what we are assessing and giving students multiple opportunities to show what they know.

- What do the pictures show and what don't they show?
- Are there lines or arrows in the pictures? What do they represent? How do we know?
- Are there labels? Do the labels make the ideas clearer? If so, how?
- How is evaporation usually represented in science books? In what ways are these representations the same, and in what ways are they different from the students' ones?
Other resources
Salient points from the literature about understanding the water cycle
What are New Zealand students' ideas about changes of state of water and the water cycle?
Exemplars
- This Level 5 exemplar shows a student's progress in using representations to describe the nature of matter: It's elementary
- On the Science Is site there are two activities that explore scientists' representations of atoms:
- Level 5-8, Models of the atom from Democritus to Rutherford
- Level 5, Selecting models of atoms
- Ministry of Education (2001). Building Science Concepts Book 15, Where's the water? Wellington: Learning Media.
- Ministry of Education (2003). Building Science Concepts Book 31, Water and weather. Wellington: Learning Media.
- Ministry of Education (1998). Making better sense of the material world. Wellington: Learning Media. Refer to the chapter Water.
- Ministry of Education (2000). Connected 1. Wellington: Learning Media. Making puddles (pp. 12-17).

