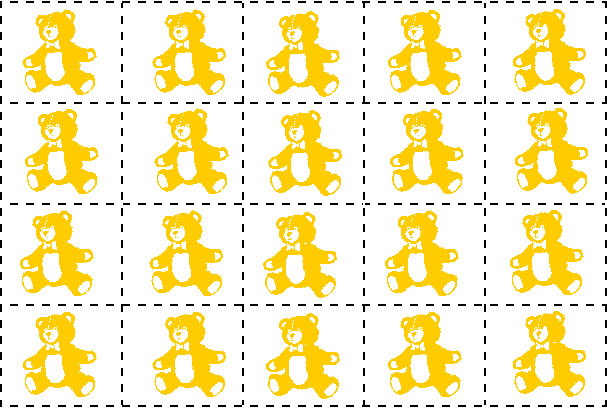
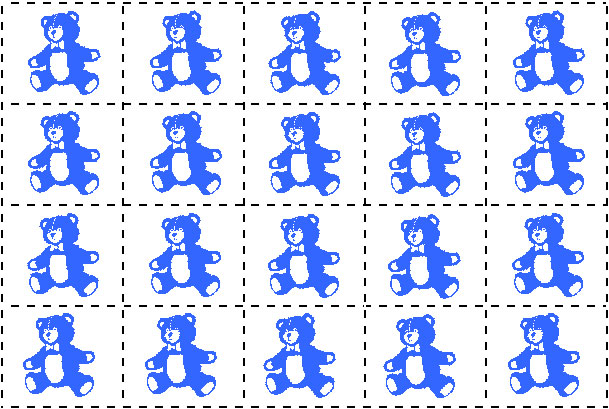
Bear mixes
|
Questions/instructions
Write the number of blue bears and yellow bears in the boxes. The first one has been done for you. |
||||
|
||||
| 1. | There are 4 bears altogether. 2 are yellow. How many are blue? |
|
||
| 2. |
There are 10 bears altogether. 6 are yellow. How many are blue? |
|
||
| 3. |
There are 10 bears altogether. There are 2 more blue bears than yellow bears. How many of each colour are there? |
|
||
| 4. |
There are 12 bears altogether. There are twice as many yellow as blue bears. How many of each colour are there? |
|
||
| 5. |
There are 3 blue bears. For each blue bear there are 3 yellow bears. How many yellow bears are there? |
|
||
| 6. |
There are 15 yellow bears. For each blue bear there are 3 yellow bears. How many blue bears are there? |
|
||
| 7. |
There are 16 bears altogether. For each blue bear there are 3 yellow bears. How many of each colour are there? |
|
||
| 8. |
A quarter of the bears are blue. There are 3 blue bears. How many yellow bears are there? |
|
||
| 9. |
A quarter of the bears are blue. There are 12 yellow bears. How many blue bears are there? |
|
||
| 10. |
There are 20 bears altogether. A quarter of the bears are blue. How many of each colour are there? |
|
||
| 11. |
There are 15 bears altogether. 20% are blue. How many of each colour are there? |
|
||


