Marine fish

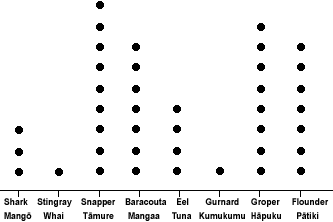
This task is about creating a dot plot from data in a tally chart.
Some students did a tally of the fish they saw in the aquarium at Marine Park.
This is what they counted.
| Shark - Mangō |
 |
|
| Stingray - Whai |
 |
|
| Snapper - Tāmure |
 |
|
| Barracouta - Mangaa |
 |
|
| Eel - Tuna |
 |
|
| Gurnard - Kumukumu |
 |
|
| Groper - Hāpuku |
 |
|
| Flounder - Pātiki |
 |

|
a)
|
Complete the dot plot below showing the students' results. Remember to give your graph a title.
|
|
|

|
b)
|
Which was the most common fish the students saw? _______________
|
| c) | The students saw the same number of flounder as which other fish? _______________ |