Tomato plants
0
Overview
Using this Resource
Connecting to the Curriculum
Marking Student Responses
Working with Students
Further Resources
This task is about putting data into a table and explaining what the data means.
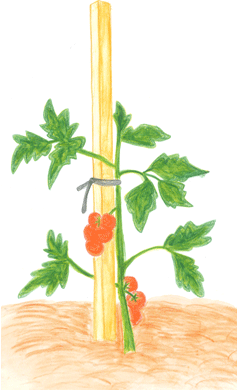
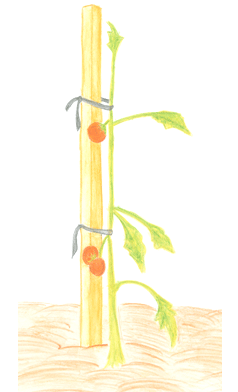
Ally and Jack each grew a tomato plant at school. They wanted to see who could grow the healthier plant.
After three weeks they drew pictures of their plants.
| Ally's plant | Jack's plant |
 |
 |
Task administration:
- This task is completed with pencil and paper only.
- Print copies of the assessment in colour.
Level:
2
Curriculum info:
Keywords:
Description of task:
Students compare drawings of a healthy and unhealthy plant, collect data, and decide which data distinguishes them. This is a mathematics/science resource.
Curriculum Links:
Science capabilities
The capabilities focus is brought about by the conversations you have and the questions you ask.
The capabilities focus is brought about by the conversations you have and the questions you ask.
Capability: Gather and interpret data
This resource provides opportunities to discuss how to collect data from representtions and present it in a table.
Capability: Use evidence
This resource provides opportunities to discuss that good science explanations are supported by evidence.
Science capability: Use evidence (Tāhūrangi)
Learning Progression Frameworks
This resource can provide evidence of learning associated with within the Mathematics Learning Progressions Frameworks.
Read more about the Learning Progressions Frameworks.Science capabilities:
Answers/responses:
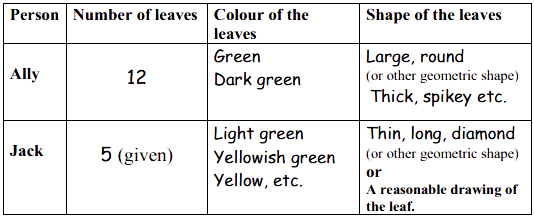
| a) |
 |
| b) | Ally |
|
Students responses ordered by level of sophistication
|
Teaching and learning:
- This resource assesses part of a Statistical investigation in a science context. It does this by using the statistical enquiry cycle (SEC) which has the mnemonic PPDACC: Pose - Plan – Data – Analyse – Conclusions – Communicate. The SEC is very similar to how you conduct a science investigation. For more information click on the link Statistical Enquiry Cycle.
- In statistics, the content and context of the investigation is vital. The context for this item is from the Life processes part of the Living world strand of the science curriculum.
Possible progressions of understanding for Data display and Analysing data could be:
Data – Display category and simple whole-number data
- Students who can display count data but not qualitative category data
- Gather and record category and simple whole number data, making some attempt to describe the categories
- Gather and record category and simple whole number data accurately including good descriptions of the category data suggests achievement at curriculum level 2 (Year 4)
Analyse - Interpret displays in context
- Cannot interpret displayed variables that are help answer a posed question
- Interpret displayed variables that help answer a posed question and can give a simple justification
- Interpret displayed variables that are help answer a posed question.
Diagnostic and formative information:
Science and Statistics Focus
Both science and statistics are interested in each of the three following features of investigations:
- Data recording in tables. Recognising that data can be quantitative (measurement of whole number e.g., 12 leaves) and qualitative (large, round, yellow etc). For more information on the different types of data click on the link, Types of data: Statistics.
- Analysing and interpreting data by choosing what variables are most relevant to a question under investigation (in this case those that indicate the relative health of two plants).
- Communicating results. It is important in statistics to communicate findings based on the data. In science, this task could link to the Investigating in science part of the Nature of science strand. Students are beginning to learn how to construct a data table.
Living world science aspects
The context for this item is from the Life processes part of the Living world strand of the science curriculum. Students were required to draw on their science knowledge about what a healthy plant looks like to assist them infer from the data which was the healthier plant, and communicate their reasons.
- All students were able to identify the healthier plant.
- Most gave some explanation, but often this just mentioned specific features (e.g., the number of leaves or tomatoes, or the colour of the leaves) but did not indicate how these related to the health of the plants.
- Only a minority gave explanations making a clear link with health.
- None explained that lots of green leaves are related to tomato plants producing their own food, but most students at Level 2 will not have sufficient understanding to make this link.
The main aspects of a healthy plant that were identified by the students in the sample were:
- a) The condition of the leaves: - Jack's are wilted. - Jack has leaves that are down. Ally has leaves that are up.
- b) The colour of the leaves. Just comparing green and light green is not enough. Describing Jack's leaves as "yellowish" is more acceptable. - because the light green [leaves of Jack's] looks like it's dead. - Jack has yellowy green leaves and Ally does not.
- c) The number of leaves or tomatoes. Ask these students to explain why "more means healthier". - Ally's one has more tomatoes and Ally's one has 12 leaves. - Ally's is healthier because there are more tomatoes.
| Common response | |
| a) |
Counting error:
11, 13
|
| a) | Describes another feature than the shape of leaves, e.g. Yellow |
| c) |
Statements without sufficient justification
Because Ally has more healthier things that Jack's.
Ally's one is healthier because her plant looks like it is supposed to look like.
I picked that one so I would be right.
|
Next steps:
Counting error
Students need to be able to accurately count sets of objects up to twenty. They may need to mark an object once it has been counted otherwise the count may be slightly short, or over.
Describes feature other than the shape of leaves
This may be a close reading issue. Get the student to re-read the heading of the final column and answer the question again. If they can then do it, they are achieving as expected. Careful reading and re-reading of mathematical situations is essential as the meaning often is very precise. If the student can still not give a written description, get them to respond orally.
Statements without sufficient justification – Peer assessment
Students need to realise that the reader should understand why they made their choice. It may be that the student's writing skills are a barrier. These students could share their explanation (or explanations from this resource) in a group to identify details and clarify ideas that are needed in their explanations. Students could develop criteria for an explanation and do some peer assessments. They could also have a "sufficient" explanation modelled and made explicit to them. The criteria might include the following ideas written in students' own words:
1. specific details;
2. appropriate use of or reference to examples;
3. justification;
4. clarity to another reader.
Click on the link below to the English resource (Writing an explanation) for further information or ideas about supporting self-assessment.
For other similar resources, click on the link or use the keyword, planning investigations.
For other similar ARB mathematics or science resources on collecting data in tables, click on the link or use the keyword table construction.
For other similar resources on collecting data in tables, click on the link or use the keyword table interpretation.
For other similar science resources that include explanations:

