Zoe's heartbeat

Zoe's heartbeat

Pencil and paperOnline interactive
Overview
Using this Resource
Connecting to the Curriculum
Marking Student Responses
Further Resources
This task is about graphing a story.
Read the story about Zoe.
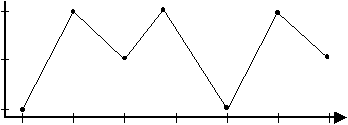
Use it to draw a line graph to show how fast her heart was beating at different times of the day.
When Zoe woke up in the morning her heart was beating very slowly. After biking to school her heartbeat was very fast. While sitting at her desk her heartbeat was normal. At playtime, Zoe played tag and her heartbeat was very fast. During reading time, she felt sleepy and her heartbeat had become very slow. At lunchtime Zoe went to kapa haka practise and her heartbeat went really fast. She then went inside to listen to a story and her heartbeat went back to normal.

Question Change answer

Zoe's Heartbeat
Task administration: 
This task is completed with pencil and paper or online
Level:
3
Description of task: 
Students construct a line graph to show the relationship between Zoe's heartbeats at different times of the day.
Learning Progression Frameworks
This resource can provide evidence of learning associated with within the Mathematics Learning Progressions Frameworks.
Read more about the Learning Progressions Frameworks.
Answers/responses: 


 Y5 (03/2001)

Draws a line graph.

 moderate

Award the marks below even if the graph has not been drawn as a line graph.

All seven points approximately aligned to the relevant time of day (i.e., aligned to x-axis).

The points are plotted accurately on the graph in relation to the number of heartbeats (i.e., aligned to the y-axis).

  • At "Woke up" the point is at about "very slow".
  • At "Got to school" the point is at about "very fast".
  • At "Sitting at desk" the point is at half way, i.e., "normal".
  • At "playtime" the point is at "very fast".
  • At "reading time" the point is at about "very slow".
  • After "lunchtime" the point is at about "very fast".
  • At "story time" the point is at "normal".

This is an example of what the graph might look like. The angle of the sloping lines will vary.

easy


all correct – easy

3-6 correct – very easy