Picking peaches

Picking peaches

Pencil and paper
Overview
Using this Resource
Connecting to the Curriculum
Marking Student Responses
Further Resources
This task is about creating a graph from data.
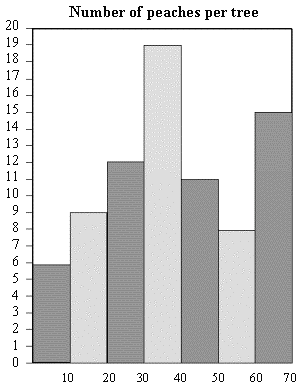
Here is a frequency chart of the peaches picked from each tree in an orchard.
   

Number of peaches
Frequency
1-10
11-20
21-30
31-40
41-50
51-60
61-70
6
9
12
19
11
8
15

Draw a graph for the data above. Remember to give your graph labels and a title.


Task administration: 
This task is completed with pencil and paper only.
Level:
4
Description of task: 
Students draw a graph from data about peaches picked in an orchard displayed in a frequency chart.
Curriculum Links: 
This resource can be used to help to identify students' ability to construct a bar graph with intervals.
Learning Progression Frameworks
This resource can provide evidence of learning associated with within the Mathematics Learning Progressions Frameworks.
Read more about the Learning Progressions Frameworks.
Answers/responses: 


Y8 (09/1999)

  • Draws a bar graph.
  • Title includes both ideas: "Number of peaches" and "picked per tree".
  • Appropriate labels given, e.g., x-axis = "Number of peaches"; y-axis = "Frequency" or "Number of trees".
  • The axes are numbered, e.g., x (numerical values): 10, 20, 30 ...) and y (frequency/count): 0-20.
  • The axes are numbered in an even and well spaced way.

histogram of peaches picked from trees

draws a bar graph - moderate

correct title - difficult

appropriate labels - difficult

axes are numbered - moderate

axes are numbered and spaced evenly - difficult

all data plotted correctly - moderate

1-2 errors in data - moderate