NZ population

NZ population

Pencil and paper
Overview
Using this Resource
Connecting to the Curriculum
Marking Student Responses
Working with Students
Further Resources
This task is about creating a bar graph to show information.
 Table of the population of four South Island Regions in 1991 and 1998
 

South Island Regions

1991 Population

1998 Population

Change

Tasman

36,400

39,600


Nelson

38,000

41,400


Marlborough

36,700

39,700


West Coast

34,000

32,900


a)
 
Complete the change column on the table above.
 
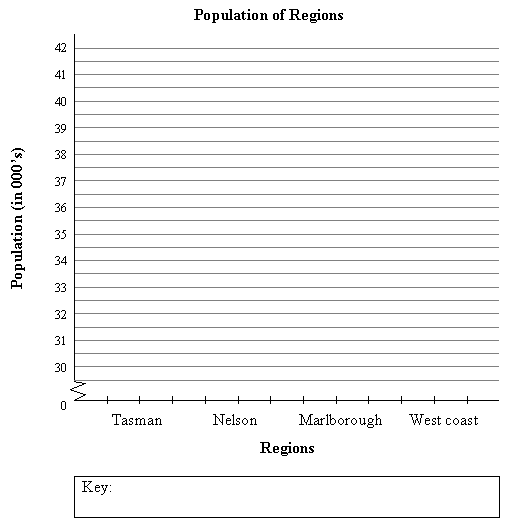
b) Draw bars on the graph below to show
 
  i)
  
ii) 
the 1991 population for each region.
  
the 1998 population for each region.
 
c) Shade the 1991 and the 1998 bars on the graph differently, and give your graph a key.


Task administration: 
This task is completed with pencil and paper only.
Level:
4
Description of task: 
Students complete a frequency table about South Island populations and construct a composite bar graph with a key.
Curriculum Links: 
This resource can be used to help to identify students' ability to construct a composite bar graph.
Learning Progression Frameworks
This resource can provide evidence of learning associated with within the Mathematics Learning Progressions Frameworks.
Read more about the Learning Progressions Frameworks.
Answers/responses: 
 

Y10 (05/2000)

a)
 
Tasman
Nelson 
Marlborough 
West Coast


3200
⁻ 3400
3000
1100

For all correct - moderate
 
3 correct - very easy

b)

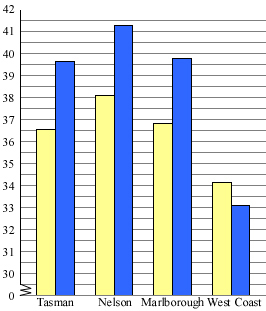
Population of regions

all bars in correct position - easy
 
all bars to correct height -  easy
 
1-2 errors in height - very easy

c)

Shades the 1991 and the 1998 bars differently, with all the 1991 bars the same and all the 1998 bars the same, and gives a key which clearly shows which bars are for each year.

very easy
Diagnostic and formative information: 
  Common error Likely reason
a) 1100 Ignores the negative sign (which indicates a drop in population).