Number of deaths

Number of deaths

Pencil and paper
Overview
Using this Resource
Connecting to the Curriculum
Marking Student Responses
Working with Students
Further Resources
This task is about making a line graph.
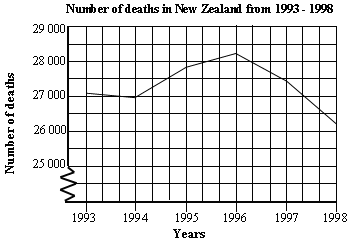
The following statistics are for the total number of deaths in New Zealand from 1993 to 1998.
   

Year

Number of Deaths

1993

27 100

1994

26 953

1995

27 813

1996

28 255

1997

27 471

1998

26 206


Using these data, draw a line graph on the grid below.
Remember to label the graph and give it a title.


Task administration: 
This task is completed with pencil and paper only.
Level:
4
Description of task: 
Students construct and label a line graph from a table of data about deaths in N.Z.
Curriculum Links: 
This resource can be used to help to identify students' ability to complete a line graph .
Learning Progression Frameworks
This resource can provide evidence of learning associated with within the Mathematics Learning Progressions Frameworks.
Read more about the Learning Progressions Frameworks.
Answers/responses: 
 

Y8 (09/1999)

The graph drawn is a line graph.
 

Title includes at least two of:
"Deaths", "New Zealand", and "1993-1998".

Appropriate labels given,
e.g., x-axis = "Years", y-axis = "Number of deaths"

The axes are numbered.
x = 1993-1998, y = 25 000...

The axes are numbered evenly and are well spaced.


drawn as line graph - easy

correct title - moderate

correct labels - easy

correct axes - very easy

correct spacing of axes - moderate


correct plotting of all points -  moderate

1-2 errors in plotting - easy

Diagnostic and formative information: 
Common error
  • Title of graph omitted.
  • x-axis compacted so only a small part of the graph paper is used.
  • y-axis is labelled with the data from the table.