Car maintenance

Car maintenance

Pencil and paper
Overview
Using this Resource
Connecting to the Curriculum
Marking Student Responses
Working with Students
Further Resources
This task is about comparing the different costs of two garages.
Two garages charge for repairs in different ways.
  • Kakariki Garage charges a standard $40 for a first look, and then $30 per hour for servicing.
  • Honore's Garage charges $60 for the first look, and then $25 per hour for servicing.
a)   Complete the table below to work out the costs of each garage for the hours they work.

 
Garage Hours worked on the car
1st look 1 hour 2 hours 3 hours 4 hours 5 hours 6 hours 7 hours
Kakariki $40 $70 $_____ $_____ $_____ $_____ $_____ $_____
Honore's $60 $85 $_____ $_____ $_____ $_____ $_____ $_____
 
b)
 
Use your results in the table above to draw and label a graph that shows the cost of using each garage over time (in hours). 
 
 
 Cost of work on the car by hours worked
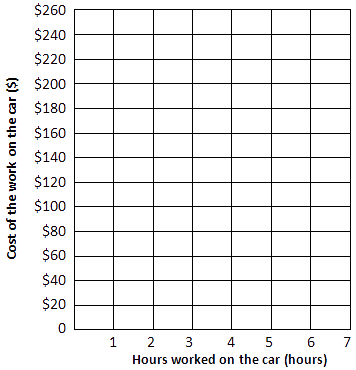
 
empty graph
 

Key

  ––  Kakariki Garage

- - - Honore's Garage

c) Use the graph to help you explain when it's cheapest to use each garage.


Task administration: 
This task is completed with pencil and paper only.
Levels:
4, 5
Description of task: 
Students calculate the repair charges of two different garages, graph them, and explain the results.
Curriculum Links: 
This resource can help to identify students' ability to use inverse operations to solve simple linear relationships.
Key competencies
This resource involves showing how to solve two simple linear equations simultaneously using tables and graphs. This relates to the Key Competency: Using language, symbols and text.
Learning Progression Frameworks
This resource can provide evidence of learning associated with within the Mathematics Learning Progressions Frameworks.
Read more about the Learning Progressions Frameworks.
Answers/responses: 
  Y8 (05/2006)

a)  i)

ii)

100, 130, 160, 190, 220, 250

110, 135, 160, 185, 210, 235

2 marks (for all 6 correct)
or
1 mark (for 1 error)

2 marks (for all 6 correct)
or
1 mark (for 1 error)

b)

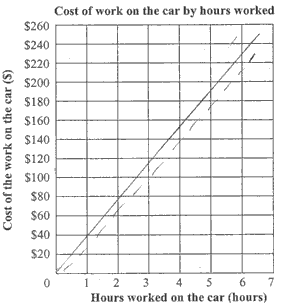
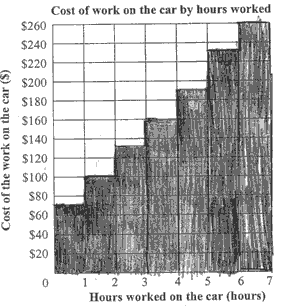
Draws two line graphs with intercepts at 40 and 60 respectively. [Accept a step graph which assumes that charges are only for full hours of work] Draws two line graphs which bend the line to pass through the origin,
or
Draws line graph starting at 1 hour.

Accuracy of plotting points. [NOTE: This should be based on the actual answers students gave in part a).]

2 marks or
1 mark

3 marks  (for all correct)
or
2 mark  (for 1-4  errors)
or
1 mark (for some points correctly plotted)

c)

Identifies the breakeven point and which garage is cheaper.
  e.g., "It is cheaper to use Kakariki until 4 hours. After that it is cheaper with Honore's."

Identifies the trend of the cheaper garage without the breakeven point as a specified length of time, or gets the breakeven point wrong.
   e.g., "The cheapest garage for 7 hours is Honore's. The cheapest garage for 1 hour is Kakariki."

[Accept if based on tables of graphs in a) or b)]

2 marks

 or

1 mark


Diagnostic and formative information: 
  Common error Likely misconception
a)  i)
     ii)
110, 150, 190, 230, 270, 310
145, 205, 265, 325, 385, 445
Confuses intercept (cost for a first look) and slope (hourly cost). Adds on $40 or $60 for each hour of servicing.
a)  i)
     ii)
140, 210, 280, 350, 420, 490
170, 265, 350,435, 520, 605
Ignores the intercept (40 or 60) and assumes the total charge for 1 hour equals the slope.
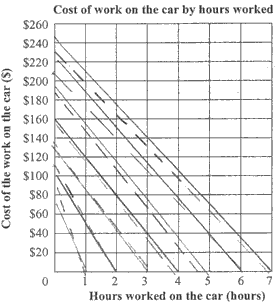
b) Incorrect use of line graphs:

  • joins origin to end point;
  • bend the line to pass through the origin;
  • starting at 1 hour.
Ignores or misinterprets the role of the intercepts ($40 or $70), preferring an intercept of $0.
b) Uses an other type of graph:

  • Histogram
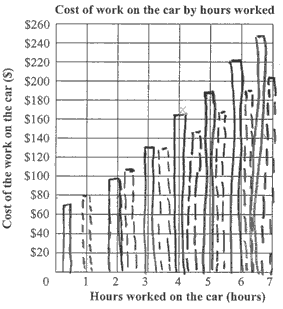
  • Bar graph (often a series of vertical lines)
  • Scatterplot
  • Relationship graph
 
c) Makes no comparison between the two garages. e.g., "It's cheaper to use the garage at the start because the longer you're in the garage, the more expensive it is."  
c) Honore's, because it has a lower hourly cost. Example: "Honore's Garage is cheapest because for every hour it's only $25." Ignores the effect of the lower intercept (set up cost of $40) for Honore's garage.
c) Kakariki's because it is cheapest at the beginning of the table. Ignores the effect of the lower slope (hourly rate of $25) for Honore's garage.
c) Identifies Honare's  or Kakariki's as cheapest with no justification.  
Next steps: 

Completing patterns:
Students who cannot complete the number patterns in a) need further understanding and practice in extending a pattern. Firstly they need to extend patterns that start from zero and have a fixed increment (e.g., 30, 60, 90, 120, …). They then need to work on patterns with an intercept and a fixed increment (e.g., 40, 70, 100, 130, …).

Graphing:
Students need to identify that a line graph is the appropriate way to display this kind of information. A discussion of the merits of other forms of graphs, especially a step graph, would be useful. Understanding the role of the intercept (i.e., what happens at time = 0) is important to establish. This should then be linked to the idea of beginning the graph at zero. This could be scaffolded by asking students what the cost would be for half an hour, and then one tenth of an hour of work (6 minutes).

Breakeven point:
Students need to identify the meaning of two lines crossing each other being interpreted as having the same amount on the y-axis at a given point on the x-axis.

NOTE:

  • Both algebra and statistics produce graphs similar to the one in this resource. The fundamental difference between the two is that an algebraic graph is based on a rule which gives exact values, whereas statistical graphs are based on data which is intrinsically variable in nature. In real life, most relationships are statistical, but some have such a small amount of variation that they can be used as algebraic for practical purposes.
  • Science investigations produce data for statistical graphs, many of which are very close to algebraic in the sense that a smooth curve exactly fits through them (search for interpreting graph interpretation in Science).

Incorrect student examples

Step graph

This graph could be seen as correct if only complete hours are charged
Bend the line

Line graph bends to pass through the origin rather than intercepts of (0, 40) and (0, 60)
Starting at 1 hour
Joins origin to end points
Histogram
Bar graph
Scatter plot

The student attempts to plot points using the key but does not connect them with a line
Relationship graph