Employment data

Employment data

Pencil and paper
Overview
Using this Resource
Connecting to the Curriculum
Marking Student Responses
Further Resources
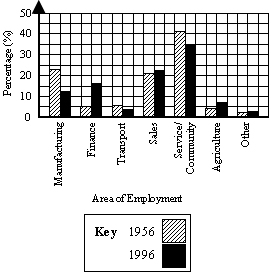
This task is about constructing and then reading information from a graph.

The table shows the number of people working in different areas of employment, in 1956 and 1996, as a percentage of all people in the workforce for each of these years.
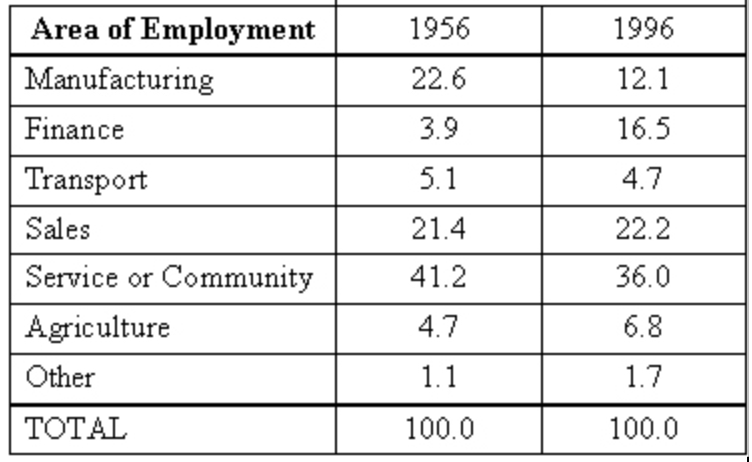
Area of Employment.jpg


a)
Graph this data as a composite bar graph on the grid below.
 
 
Percentage of People in Different Area of Employment in 1956 and 1996
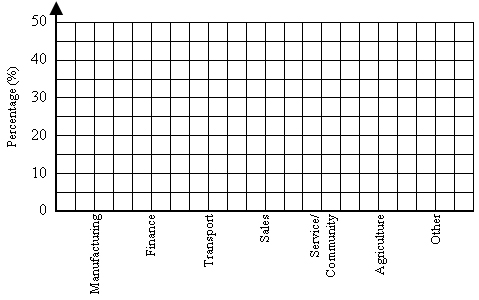

Area of Employment
 
b)
Between 1956 and 1996, which area of employment had:
 
 
i)  the largest percentage decrease in people working? ____________
 
ii)  the largest percentage increase in people working? ____________
 
c)
Name two areas of employment where the percentages of people working are most similar in 1956 and 1996.
 
____________________  and  ____________________
Task administration: 
This task is completed with pencil and paper only.
Levels:
4, 5
Description of task: 
Students construct a composite bar graph on areas of female employment in 1956 and 1996. They also answer questions interpreting and comparing the data.
Curriculum Links: 
This resource can be used to help to identify students' ability to construct and interpret a composite bar graph.
Learning Progression Frameworks
This resource can provide evidence of learning associated with within the Mathematics Learning Progressions Frameworks.
Read more about the Learning Progressions Frameworks.
Answers/responses: 
  

Y10 (10/1998)

a)    Data drawn correctly.
Key given.

easy
easy
b) i)
ii)
manufacturing
finance
easy
easy
c)  
  
Any 2 of:

  • transport
  • sales
  • other
easy