Lighting
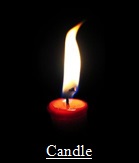
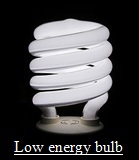
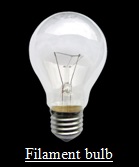
| Type of light | Number needed to get the same brightness | Total energy used every second (joules) | How long does it last? |
 |
120 candles | 4800 J | 2 hours |
 |
1 low energy bulb | 18 J | 2 years |
 |
1 filament bulb | 100 J | 9 months |
Images source: Wikipedia
| a) | i) |
Which type of lighting would be good if there was an electrical power cut?
____________________
|
| ii) |
Explain your choice.
|
| b) | i) |
Which type of lighting is best for saving energy? ____________________
|
||||||||||||
| ii) |
Explain your choice.
|
|||||||||||||
| c) | i) |
The candles and bulbs all produce light and heat. The table shows lighting that produces the same amount of light.
Which type of lighting produces least heat energy? ____________________ |
||||||||||||
| ii) |
Explain your choice.
|
|||||||||||||
| d) |
Fill in the table below, describing one advantage (good thing) and one disadvantage (bad thing) of each type of light.
|
|||||||||||||
|
||||||||||||||
The task was trialled by students individually completing the written worksheet. However, students could work in groups or as a class, debating their answers and coming to a consensus. Carrying out the task in this way is likely to provide additional evidence of students' thinking.
The capabilities focus is brought about by the conversations you have and the questions you ask.
Science capability: Interpret representations (Tāhūrangi)
| Y6 (03/2010) | Y8 (03/2010) | Y10 (03/2010) | |||
| a) | i) | Candle | very easy | very easy | very easy |
| ii) | Any answer that shows an understanding that it isn't powered by electricity | easy | easy | easy | |
| b) | i) | Low energy bulb | easy | easy | very easy |
| ii) | Any answer that shows an understanding that it uses up less energy | easy | easy | easy | |
| c) | i) | Low energy bulb | moderate | easy | easy |
| ii) | As they all produce the same amount of light the light source using the least amount of energy produces the least heat. | very difficult | very difficult | difficult | |
| d) | i) | Describes an advantage (e.g., it doesn't need electricity, it is cheap to buy, it is portable) and a disadvantage (e.g., you need 120 to get the same brightness, it only lasts 2 hours, it can cause fires, it can blow out). | easy | moderate | easy |
| ii) | Describes an advantage (e.g., it is economical, you only need one, it uses less electricity than a filament bulb, it doesn't waste energy on heat/doesn't get hot, it lasts a long time) and a disadvantage (e.g., it uses electrical energy, it is expensive to buy). | difficult | very difficult | difficult | |
| iii) | Describes an advantage (e.g., it is cheap to buy, you only need one, it lasts longer than a candle) and a disadvantage (e.g., it uses a lot of electricity, it only lasts for 9 months, it gets hot). | difficult | difficult | difficult |
Based on a representative sample of 112 year 6, 143 year 8 and 299 year 10 students.
Background information
This task was trialled at Years 4, 6, 8, and 10. Student responses can therefore be compared across the levels. (Note that following the trial the task was simplified to make it more relevant for L 2 students. Go to Lighting Shane's bedroom.)
Science information is often presented in tables, so learning about tables and how to read them helps students to interpret data presented in this format. Understanding the strengths and weaknesses of presenting information in a table is a precursor to choosing when tables are the best option for presenting their own data.
Electricity consumption has both environmental and economic impacts. The context of lighting is one that students can be involved in decision-making in their own lives. The questions support skill-building that enables students to evaluate information.
The key ideas that are covered in the task are shown in the table below.
| Nature of science idea | Science knowledge |
Communicating in science
|
Physical concepts
|
| Nature of science: Communicating in science (tables) |
|
Most students seemed to be familiar with tables as a way of presenting information. In general terms they knew how to read the first table, although did not always interpret the detail well. Most of those who attempted filling in the second one were able to enter their responses in the correct place. However, there is also evidence that some students didn't use the table to answer questions, relying more on their background knowledge. This was particularly obvious in Question d). Year 8 students appeared to be less able to correctly answer this question than Year 6 students. One reason may be that Year 8 students were more likely to be using the table to find the answers rather than using background information, but often misinterpreted the data contained in it. A second reason was that Year 8 students were more likely than Year 6 and Year 10 students to interpret the information that candles and bulbs produce heat (and light) in Question c) as an advantage and use this to answer Question d). Few Year 6 students were cued by Question c) to associate heat as either an advantage or disadvantage in Question d) and Year 10 students were more aware than the younger students that heat was a disadvantage, i.e., an inefficiency of lighting. The areas that caused difficulties were:
|
| Science concept: lighting |
|
Scientific vocabulary Younger students often used the words "power", "energy" and "electricity" interchangeably (as we are inclined to do in our everyday conversations), but older students were much less likely to. For Question b) about a sixth of Year 6 and Year 8 students chose the candles as being best for saving energy. Most gave reasons that showed they interpreted energy as electrical power, therefore equating "saving energy" with not using electrical power. If your students did have an issue with the specialised vocabulary go to Lighting Shane's bedroom for more information.
Question c): The relationship between heat and light
About a fifth of Year 6 students gave a partial answer and about a half gave a wrong answer or did not attempt to answer. This number had risen to a third of Year 8 students as more of them were attempting to give a more logical explanation (about a fifth getting it wrong or not attempting an explanation). At Year 10 about a fifth of the students were still giving a partial answer but about a third were now giving a good explanation which linked the different factors (about a fifth were getting it wrong or not attempting an explanation). Example of a good explanation: Examples of good explanations that made links to both energy use and heat from younger students even though there are some gaps in their explanations:
|
Misconceptions
Some students' responses suggested misconceptions about electric lights.
|
Student response |
Likely misconception |
|
Because it's got something round it to stop the heat coming out. Year 6 |
A light bulb contains or has heat. |
|
(A disadvantage of a filament bulb is there is) not as much heat as from candles. Year 8 |
Considers producing heat is an advantage. Do not make the connection that less heat is desirable because the bulb is then more efficient at its primary function, producing light. |
|
(A candle produces least heat energy) because it lasts two hours. Year 6 |
Associates heat produced with the amount of time the light lasts, rather than calculating from the total joules used. Possibly does not recognise that heat and light are both forms of energy. |
|
(A candle produces least heat energy) because they have light and heat. Year 8 |
Heat is only associated with the candle. |
Give students practice in interpreting what the table is about. Include careful attention to the headings used, as well as the relationships between the columns. Encourage students to look both across one row (which in this table tells you about each type of light) and down the columns (to compare the different lights). Ask questions such as:
- What story can we tell about the candles (light bulb, low-energy bulb) from looking at the table?
- What can we tell about how much energy a candle and a low-energy bulb use?
- The table doesn't tell us where candles or the bulbs get energy to make light. How do you think we can make them light up? How could we check our ideas? (These questions relate to what the table doesn't tell us but assumes we know.)
- Ask questions that require students to make calculations or inferences from the data provided. Advertisements that provide data about low energy lighting can be a useful source for students to work with.
- Students can set up investigations to investigate their ideas about the relationship between light and heat output. They should be encouraged to share and debate their explanations with others.
Interpreting tables
For further information about teaching about tables go to Tables and graphs
Lighting
Ministry of Education (1999). Making Better Sense of the Physical World. Wellington: Learning Media. Refer to the section, Electricity.
Science capabilities
Interpret representations
- Work schedule
- School tests
- Junk mail
- Hot coffee anyone?
- Frost
- Library books
- Speed trap
- Properties of household goods
- Kauri trees
- Hutt Valley trains
- Media forecasts
- Speed camera
- Properties of paper
- Native trees in NZ
- World Cup soccer
- The Beaufort scale
- Prize draw
- Eyes and hair colour
- School rubbish
- Car maintenance
- Letters to houses
- Healthy tomato plants
- Flight schedule
- Beach clean-up

