Healthy tomato plants

Healthy tomato plants

Pencil and paper
Overview
Using this Resource
Connecting to the Curriculum
Marking Student Responses
Working with Students
Further Resources
This task is about students deciding which data/variables can be measured from two pictures of plants and interpreting the measurements.
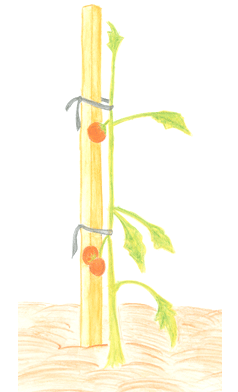
Ally and Jack each grew a tomato plant. They wanted to see who could grow the healthier plant. After three weeks they drew pictures of their plants.
Ally's plant Jack's plant

  1. Name three different features of these two tomato plants that you could collect as data. Include different types of data if you can (i.e., data that is measured in different ways).


    1. __________________________________________________________________

    2. __________________________________________________________________

    3. __________________________________________________________________
 
  1. Which data is the most useful to show Ally has the healthiest plant?


    1. __________________________________________________________________

    2. __________________________________________________________________

    3. __________________________________________________________________


  1. Explain your choices for Question b.
 

  1. __________________________________________________________________

  2. __________________________________________________________________

  3. __________________________________________________________________
 
  1. Use any data about Ally's and Jack's tomato plants to:
  • Put headings in the following table i) – iii)
  • Record the measurements iv) – ix)

    The first column has been done for you.


    Person

    Number of
    leaves

    i)

    ii)

    iii)


    Ally


    12

    iv)


    vi)

    viii)


    Jack


    5

    v)


    vii)

    ix)

 
  1. What things might have made Jack's plant grow differently to Ally's?

    _____________________________________________________________________________

    _____________________________________________________________________________

    _____________________________________________________________________________

    _____________________________________________________________________________

    _____________________________________________________________________________

Task administration: 
Equipment;
A ruler for each student
  • Print copies of the assessment in colour.
  • To answer questions b) and c) teachers could support students by choosing one of the following:
  1. Students discuss in groups and then report back to the class their list of different features of tomato plants that could be collected as data.
  2. Teachers discuss the different types of data that students could identify, e.g.:
  • Colour of the leaves
  • Number of tomatoes
  • Number of leaves
  • Height of the plant – measurement or description
  • Shape of the leaves – measurement or description.
Levels:
3, 4
Description of task: 
Students compare drawings of a healthy and unhealthy plant and decide which quantitative and/or qualitative data distinguishes them. They draw conclusions from the data. This is a mathematics/science resource.
Curriculum Links: 
This task can help to identify learning about identifying different types of relevant data and recording data in a table.
 
Science capabilities
The capabilities focus is brought about by the conversations you have and the questions you ask.
 
Capability: Gather and interpret data
This resource provides opportunities to discuss:
  • the importance of precise observations and measurement when gathering information.
  • measuring accurately is important in investigations, and we have tools to help us do this
Learning Progression Frameworks
This resource can provide evidence of learning associated with within the Mathematics Learning Progressions Frameworks.
Read more about the Learning Progressions Frameworks.
Answers/responses: 
a) i)-iii)
Any of:
  • Qualitative (descriptive) data e.g., colour, condition, or shape of the leaves
  • Whole number (count) data e.g., number of tomatoes or leaves
  • Measurement data e.g. height of the plant
b) i)-iii)
Any of:
  • Colour of the leaves
  • Number of tomatoes
  • Number of leaves
  • Shape or condition of the leaves
[Do not accept: height of the plant – in this case this is not an indication of good health.]
c) i)-iii)
Any reasonable answers that explain the relationship of the variables identified for Question b) with the health of the plants.
Examples:
[The leaves] because they are a vital part in a plant's health.
The [number of] tomatoes because they are a good sign the plant is healthy.
The colour, because if it [is] dried up it will die.
If the colour is light then it is dehydrated.
d) i)-iii)


iv) - ix)
Any three of
  • Number of tomatoes
  • Colour of the leaves
  • Height of the plant
  • Length of leaves
  • Condition of leaves
  • Condition of plant.
The correct corresponding data entered, i.e., 
  • Number of tomatoes – Ally 8, Jack 3
  • Colour of the leaves – Ally green, Jack yellow
  • Height of the plant – Ally short, Jack tall or actual lengths (NB: this response indicates a scaling error) or Ally 60-65cm Jack 90-95cm.
  • Other correct data corresponding to variable label
e)
Any of:
  • Amount of water
  • Type of soil
  • Amount of sun (light)
  • Amount of nutrients
  • Other reasonable variable such as: disease; exposed to wind; method of planting; different seeds/type of plant; etc.
 Based on a sample of 20 Year 7 and Year 8 students
Teaching and learning: 
Statistical investigations in a science context
This task requires students to use their science knowledge to analyse data. The task would be more authentic if students used data collected from their own investigations into growing healthy plants. Another alternative is to use this task after such an investigation to see if they can apply what they have learnt.
 
Note that the trial was not carried out in conjunction with a science investigation, i.e., the trial students completed the task "cold". Most students did seem to have some general concept of what a healthy plant looks like, but those who were able to draw on experiences or knowledge about plant needs provided more science-oriented justifications for their ideas. For example, they might have made the link that plants need green leaves to make food, so green leaves are an indication of a healthy plant. 
 
Statistics Focus
Students are demonstrating their ability to perform part of the Statistical Enquiry Cycle (SEC) by:
  1. Naming different types of data that can be collected from a real science context. Data can be category data (e.g., leaf colour; height is tall or short), whole number (e.g., number of tomatoes), or measurement (e.g., height in cm). For more information, click on the link Types of data: Statistics.
  2. Using their scientific thinking to identify the most useful ones to collect.
  3. Collecting and displaying data in a tabular format. These represent the Plan and the Data steps of the SEC. The full cycle is Pose – Plan – Data – Analyse – Communicate. For more information click on the link Statistical Enquiry Cycle. 
 
Science Focus
  1. Choosing variables: Students decide what counts as evidence, e.g., the variables between two similar plants and how these variables can be measured. They also decide what variables might result in the different growth patterns.
  2. Data types: Students recognise that data is represented in quantitative (measurement and whole number, e.g., 8 cm. or 3 tomatoes) and qualitative (category, e.g., green, yellow, etc.) forms and that it can be presented in data tables.
  3. Investigating [see parts c) and e)]: In science, this task could link to the Understanding about science part of the Nature of Science strand – "provide evidence to explain their ideas".
  4. For further information or ideas about writing explanations, click on the link to the English self-assessment guide, Writing an explanation.
Diagnostic and formative information: 
Multiple responses Questions a), b), and e) provided students with the opportunity to give multiple responses. This was particularly important for Question e). Students who identify more than one factor are more likely to be able to see that health relies on a number of factors being present.
 
  Common response
b)
Confuses height of the plant with the health of the plant
  • This response may be given because the student is looking at a variable in isolation rather than looking at the overall pattern.
  • This response may be compounded by a lack of science knowledge. (The plant in this example is using all its resources to grow tall to reach for the sun’s energy. Plants may look like this when they are grown in low light.) It is not, by itself, evidence of being healthy.
c)
Cannot give reasons for variables they mention affecting the health of plants (science)
  • This may be due to the student not having sufficient science knowledge to justify choices made.
  • They may not be able to make a link between their science knowledge and the observation. Applying science knowledge to a particular instance is more difficult than being able to tell what they know.
d) Records 6.2cm instead of 62 cm for example (Measurement error) Ignores scale of diagram
d)
Creates dichotomies for variables in the table Rather than identifying a variable, uses a heading such as "Is it tall?" instead of "Height", and records the result as "Y" or "N".
d)
Long rather than succinct variable names or complicated recording of the data
Students give overly complicated responses, especially to the qualitative variables such as colour.
 
Next steps: 
Identifies only one factor 
Encourage students to extend their initial ideas by asking: Are there any other things you could measure or that you can see are important? 
 
Confuses height of the plant with the health of the plant or Cannot give reasons for variable they mention affecting the health of plants (science)
There are three ideas that will help students understand that height in this case is not an indicator of health:
  1. Plants make their own food in their leaves.
  2. The green in the leaves traps the sun's energy to turn it into food for the plant.
  3. It is the combination of variables that need to be examined to make decisions about the overall health of the plant.
The first two points are about science knowledge. Students' science knowledge could be developed by:
  • Providing opportunities for students to carry out their own investigations about particular plants' optimal growth requirements;
  • Making a class list of what students already know collectively about plants' growth requirements that students can refer to;
  • Using books or websites to access this information.Note that students do not need to know all the details of photosynthesis.
For the third point, encourage students to look at the overall pattern of the data rather than pieces in isolation. In this context, ask students to look at the total score for each plant. Once they have identified that height by itself doesn't signify a healthy plant, other questions that will help students think more deeply about what the evidence tells them are: 
  • What might be the reasons for the unhealthy plant being taller? For this question they will need to use their contextual knowledge (in this case science).
  • When might a healthy plant be the taller plant?
Ignores scale of diagram (Measurement error) 
Draw attention to the Scale (1cm = 10cm). 
  • What is the scale telling the reader?
  • If you want to talk about the actual size of the plant what would you need to do? 
  • Are actual tomatoes this size?
Creates dichotomies for variables in the table or Long rather than succinct variable names or complicated recording of the data 
Students should be aware that one of the purposes of a table is to present data clearly and succinctly. They could compare a written description of the same information with a table to illustrate this point. Assist students to use the variable for their headings by identifying:
  • What the answer to their question is about (e.g., Is the plant tall? is about height); or
  • The keywords in their descriptions (e.g., It shows the number of tomatoes – the important information is Number of tomatoes).
For other similar ARB mathematics or science resources on collecting data in tables, click on the link or use the keyword table construction
 
For other similar resources on collecting data in tables, click on the link or use the keyword table interpretation
 
For teacher information about constructing and interpreting tables see:
Resources that include activities about constructing and interpreting tables: 
Figure it out
  • Ministry of Education (2010). Figure It Out, Sustainability. Wellington: Learning Media. (Levels 2+-3+). See Cool Colours, pages 18-20. 
  • Ministry of Education (2004). Figure It Out, Statistics Book One. Wellington: Learning Media. (Level 4) •
  • Ministry of Education (2004). Figure It Out, Statistics Book Two. Wellington: Learning Media. (Level 4+)
  • Ministry of Education (2001). Figure It Out, Statistics. Wellington: Learning Media. (Levels 3-4)
  • Ministry of Education (2001). Figure It Out, Time Travel. Wellington: Learning Media. (Level 3). See Epidemic!, pages 20-21.
Resources that support developing understandings about the needs of plants: 
  • Ministry of Education (2004). Building Science Concepts Book 63, Growing Plants Indoors. Wellington: Learning Media