Animal graphs
0
Overview
Using this Resource
Connecting to the Curriculum
Marking Student Responses
Working with Students
Further Resources
This task is about bar graphs and tally charts.
Task administration:
This task can be completed online or with pencil and paper. If completed online, auto-marking will be displayed to students.
Level:
1
Curriculum info:
Keywords:
Description of task:
Students match bar graphs to tally charts.
Learning Progression Frameworks
This resource can provide evidence of learning associated with within the Mathematics Learning Progressions Frameworks.
Read more about the Learning Progressions Frameworks.Answers/responses:
| Y2/3 (03/2017) | ||
| a) |
 |
easy |
| b) |
 |
very easy |
| c) |
 |
easy |
| d) |
 |
easy |
| e) |
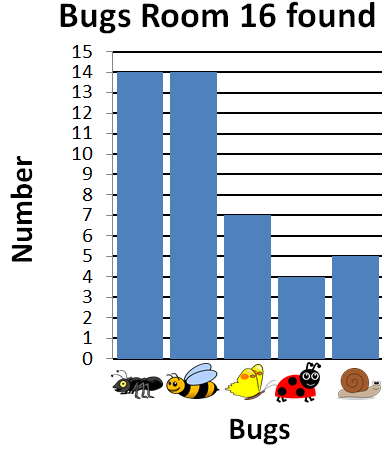 |
easy |
Based on an online sample of 25 students
Teaching and learning:
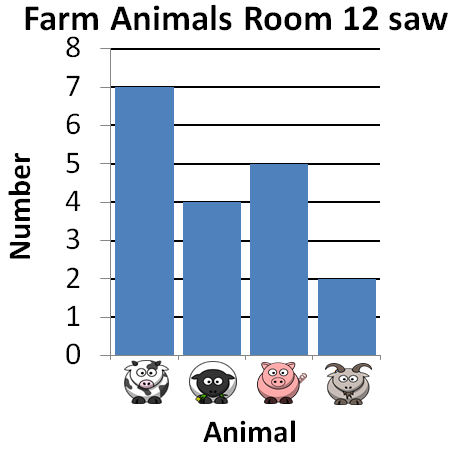
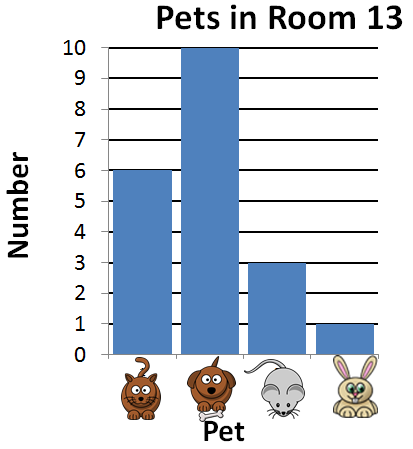
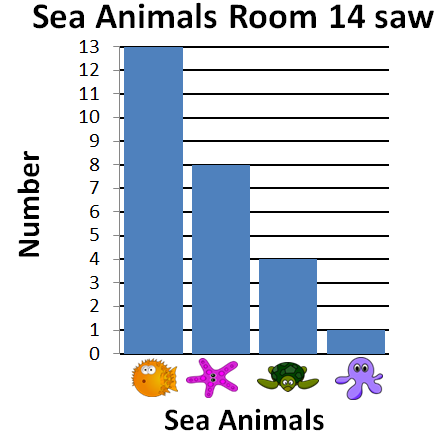
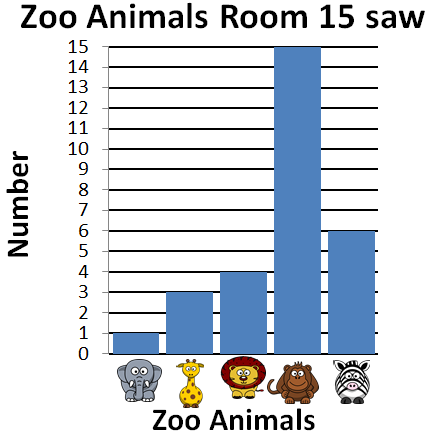
This resource is about matching tally charts to graphs. Students need to be familiar with how tallying works. They also need to know how to read a simple bar graph in order to match the numbers represented by the tallies to the graphs.
It may be necessary to model how to carry out this task by completing the first question as a class or group.
Diagnostic and formative information:
A number of students identified an incorrect graph. There are several possibilities for their choice:
- they have incorrectly counted the tally marks
- they have incorrectly matched the animal to its bar on the graph
- they have correctly matched two of the bars on the graph from the tally chart but have incorrectly matched the remainder
-
they have incorrectly read the y-axis amount
Next steps:
Incorrectly counting the tally marks
Students need to understand that each tally mark, including the diagonal mark across the four vertical marks, represents one animal.
Once students know that  represents '5' they can use their knowledge of skip counting to help them calculate the totals.
ARB resources that involve the use of tally marks:
- Coloured sticks (Level 1)
- Party food (Level 1)
- Types of fruit (Level 1)
- Phone calls (Level 2)
- Foods I like (Level 2)
- Tallying shapes (Level 2)
- Pupil ages (Level 2)
- Counting physical tasks (Level 2)
Incorrectly matching the animal to its bar on the graph or Correctly matching only two bars on the graph
Students may need to look carefully at each animal's tally and ensure the height of the bar correctly matches it. Students could work with a buddy to do this.
Incorrectly reading the y-axis amount
Students need to know how to look across the top of a bar and carefully read the number on the y-axis.
Further activities
As a follow up, students could make statements about each of the correct graphs, for example, Room 14 found the same number of ants and bees on their bug hunt.
Students could also explore what question was being asked when the data was collected.
Once students are comfortable with using tally marks and have an understanding of bar graphs they could, in pairs, groups or as a whole class, pose a question, carry out a survey, tally the responses and then construct a bar graph. Statements about these graphs could also be made so that the whole statistical enquiry cycle is followed. The ARB resource Favourites II (Level 2) uses this model.

