Distance from home

Distance from home

Pencil and paper
Overview
Using this Resource
Connecting to the Curriculum
Marking Student Responses
Working with Students
Further Resources
This task is about reading information from a graph that shows the movement of a car.
constant speed     away     faster     slower     stop     returns     towards     back
 

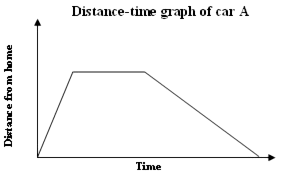
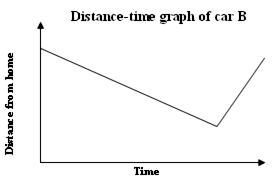
a) The two graphs below show the movements of two cars travelling near home. For each graph:

  • Describe what the car is doing. You may use the words in the box above to help you.
  • Include information about the direction the car is moving and the speed at which it is travelling at the different parts of its journey.

i)

ii)


b)
Draw a graph which shows the following four statements (1 - 4) about the distance and speed of a car that starts a journey from home.
 
  1. moves away from home at a constant speed
  2. stops
  3. continues away from home at the same constant speed
  4. returns home at a faster constant speed.


Task administration: 
This task is completed with pencil and paper only.
Level:
5
Description of task: 
Students interpret distance-time graphs that show a car's movement and draw their own graph from given statements.
Learning Progression Frameworks
This resource can provide evidence of learning associated with within the Mathematics Learning Progressions Frameworks.
Read more about the Learning Progressions Frameworks.
Answers/responses: 
  Y10 (09/2008)
a)

i)

Statements about the two directions the car goes in, i.e.:
        The car heads away from home; and
        It then returns home.

Statements about the three speeds the car goes at, i.e.:
        The car moves at a fast (constant) speed;
        It stops (or stays at a constant distance from home); and
        It moves at a slower (constant) speed.

easy

moderate

  ii)

Statements about the two directions the car goes in, i.e.:
        The car heads towards home; and
        It then moves away from home.

Statements about the two speeds the car goes at, i.e
        The car moves at a slow (constant) speed; and
        It moves at a faster (constant) speed.

moderate

easy

b)   moderate
Based on a representative sample of 161 students.
 
NOTE:

  1. Getting the direction the car travels is a little easier in part a) i) than part a) ii). In the latter, students are more likely to invert the direction of travel (i.e., make statements that the car moves away from home, then back towards home).
  2. Getting the speed that the car travels at is a little harder in part a) i) than part a) ii). For the former, nearly 10% of students interpret the horizontal line as travelling at a constant speed rather than remaining stationary.
Diagnostic and formative information: 
  Common error Likely misconception
a)

a)

b)

b)

Mentions the car going backwards or reversing.

Interprets movement away from home as being
towards home and vice versa; or
Inverts the graph.

Shows a journey that only has movement away from home or stops only.

Direction of movement
Interprets a downwards slope as the car reversing rather than moving towards home.

Confuses the direction that the car travels in.

Interprets the y-axis as the total distance travelled by the car

a)
b)
Makes no mention of speed; or
Return journey not shown as a steeper line; or The two outward journeys are shown with different slopes.
Speed of car
Does not relate the slope of the line with the speed of the car.
a) Mentions speeding up, slowing down, or acceleration. Confuses speed and acceleration
Confuses time–distance graphs which give speed; and time–speed graphs which give acceleration.
b) Draws a triangular or quadrilateral other than a trapezium. Stationary car
Ignores or does not know how to represent the car being stopped.
a) Mentions going up or down hills or going around corners Representational
Interprets the diagram as a profile of hills or as a map of a journey.
a)
b)
Only mentions one of the directions the car is travelling in.
Draws a trapesium
Ignores some of the car's movements
Ignores one of the car's movements.
Ignores the second movement away from home

Key competencies
Graphs are a very common way of conveying mathematical meaning. They therefore fit the Key competency, Using language, symbols, and text in The New Zealand Curriculum.

Next steps: 
Direction of movement
These errors indicate that the students need to pay more attention to the labeling of the axes, in particular the y-axis. In part a), get students to measure that the higher the graph, the greater the distance from home. So a positive slope means that the car is travelling away from home, and vice versa. 

Speed of car
The student needs to have experiences of plotting distance-time graphs of situations where a car keeps travelling at exactly the same distance in two consecutive periods of time of identical length. The ARB resource Car racing could be of assistance.

Confuses speed and acceleration
This error indicates that the students need to pay more attention to the labeling of the axes, in particular the y-axis. They are assuming it is speed, not distance, that is increasing. Plotting distance-time graphs as above may be helpful. The concept of acceleration is a more sophisticated concept.

Stationary car
The student could plot the distance from home after a certain time. When the car is stationary, it remains exactly the same distance away from home. Get the student to plot this same distance at a later time, and observe that this gives a flat line.

Students could discuss if there is any other possible explanation for a horizontal line. This would mean that the car moves along a circular road with home as the centre of the circle. This brings up the concept of locus.

Representational
The student thinks that the graph has a literal interpretation rather than a symbolic one. They should work on similar problems at lower levels of the curriculum. 

Click on this link, or use the keywords graph interpretation AND line graphs for further examples.

For further information about interpreting graphs see Tables and Graphs: How students interpret line graphs.
 
Line graphs like the one used in this resource are also used in science. For an example see the Physical world resource, A car journey.