Estimating the area of Antarctica
0
Overview
Connecting to the Curriculum
Marking Student Responses
Further Resources
Continent area
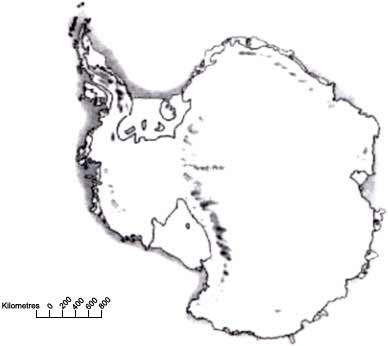
Here is a map of Antarctica.

Estimate the area of Antarctica using the map scale. Show your working out and explain how you made your estimate.
(You can draw over the map if it helps you with your estimation).
Level:
5
Curriculum info:
Keywords:
Description of task:
Students use a scale map to estimate the area of Antarctica and explain their method.
Learning Progression Frameworks
This resource can provide evidence of learning associated with within the Mathematics Learning Progressions Frameworks.
Read more about the Learning Progressions Frameworks.Answers/responses:
| Scoring: | Y11 (09/2000) | |
|
2 marks or |
These scores are for answers that use the correct method AND give the correct result. The second digit indicates the different approaches. Any 1 of:
These scores are for answers that use the correct method BUT give an incorrect or incomplete result. The second digit in parentheses indicates the different approaches, matching the second digit in parentheses of the Full credit Scores. |
16% |
|
1 mark
or
|
Any 1 of:
|
44% |
| 0 marks |
Any 1 of:
|
NOTE: © OECD (2002). Reproduced with permission of the OECD.
- Finding area and perimeter
- Measuring the extension
- How big is the community hall?
- Making road signs
- The Danish flag
- Volume and surface area II
- Changing perimeter
- Area of three shapes
- The truth about area
- Total area
- Area of 3 fields
- Same area, different lengths
- Island area
- Smallest perimeter
- Making the largest perimeter
- Enlarge the arrow
- Painting the house
- Area of the section II
- Soccer and netball
- Area and perimeter of four shapes
- Tiling rooms of a house
- Sending envelopes
- Correcting mistakes
- Area of shapes II
- Measuring tapa cloth
- How many blocks?

