Mountain climbers

Mountain climbers

Pencil and paper
Overview
Using this Resource
Connecting to the Curriculum
Marking Student Responses
Further Resources
This task is about creating a graph of measurement data.
Mount Herbert is 2 000 metres high.

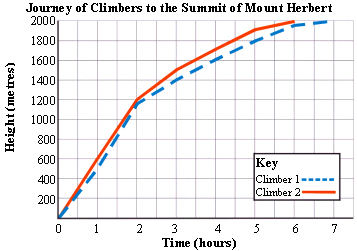
The data in the table below shows the progress, after each hour, of two climbers as they climbed to the top of the mountain.


Time (hours)

0

1

2

3

4

5

6

7

Climber 1 distance climbed (metres)

0

500

1150

1400

1600

1800

1950

2000

Climber 2 distance climbed (metres)

0

600

1200

1500

1700

1900

2000

-

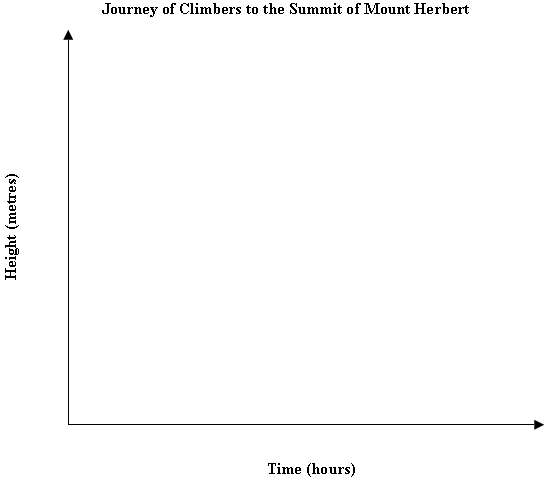
Draw an appropriate graph of the data on the axes below:
 

Task administration: 
This task is completed with pencil and paper only.
Level:
5
Description of task: 
Using data given in a table, students are required to construct a double line graph on the axes provided.
Learning Progression Frameworks
This resource can provide evidence of learning associated with within the Mathematics Learning Progressions Frameworks.
Read more about the Learning Progressions Frameworks.
Answers/responses: 

Scoring:


Y8 (11/2002)

1 mark
1 mark
 
 
1 mark
1 mark

2 marks
(for all points plotted with
reasonable accuracy)
or
1 mark
(for 1-2 errors)

A double line graph is drawn.
Appropriate key given, or lines labelled.
NOTE: Remaining marks can be allocated even if line graph has not been drawn.
The x-axis is appropriately scaled using equal intervals.
The y-axis is appropriately scaled using equal intervals.
NOTE: These may be different intervals to those drawn below.

easy
easy
 
 
easy
moderate


difficult


easy