Post a parcel

Post a parcel

Pencil and paper
Overview
Using this Resource
Connecting to the Curriculum
Marking Student Responses
Working with Students
Further Resources
This task is about comparing costs of sending parcels for two different companies.
Two courier companies charge different rates to send parcels by airmail.
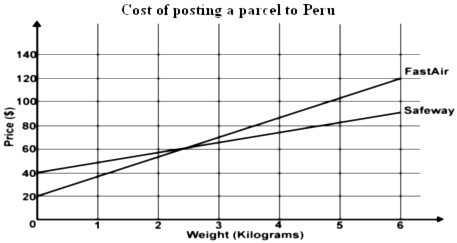
a)  This graph shows the price each company charges for sending a parcel to Peru.

graph of two companies costs

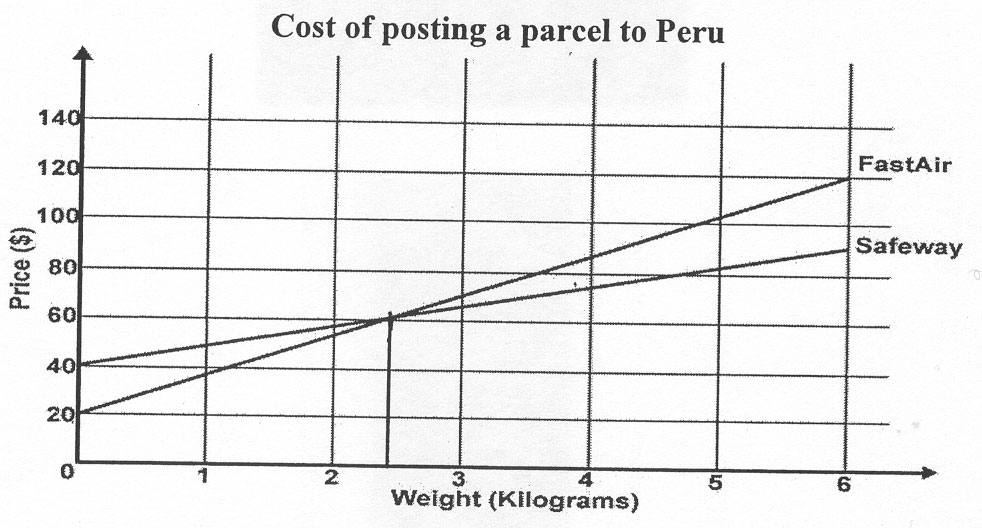
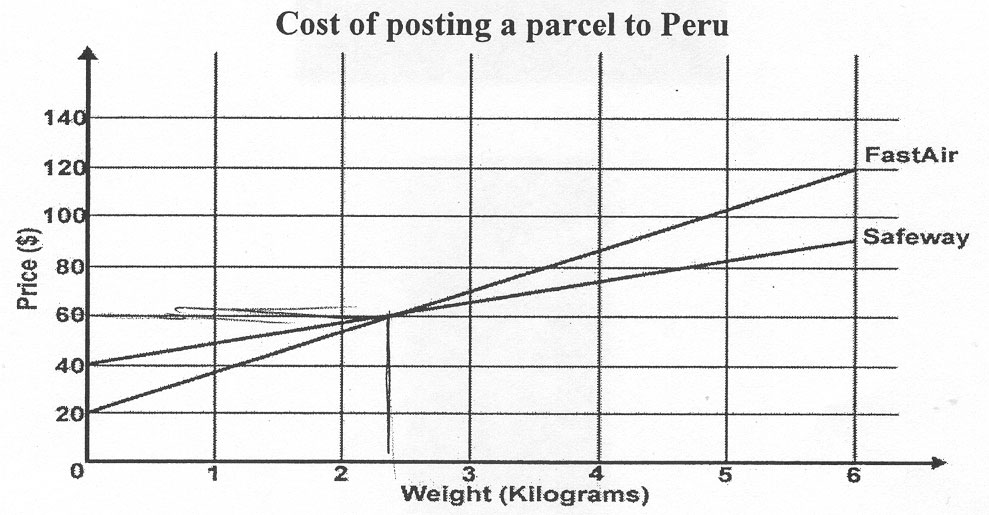
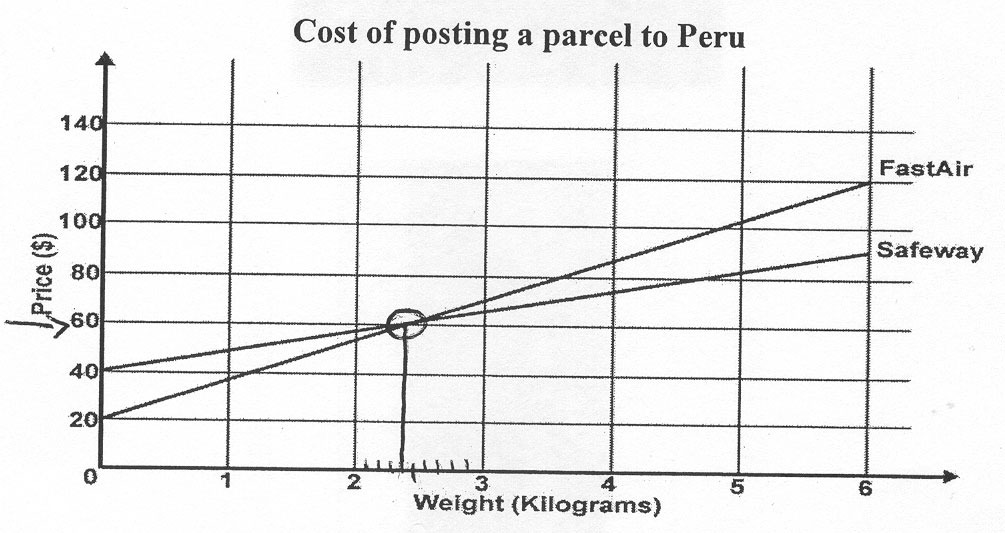
Show how to use this graph to find the weight of a parcel that both companies would charge the same amount of money to send to Peru.You may draw on the graph or write what you would do in the box below.


Weight of parcel: __________ kilograms

 
b)
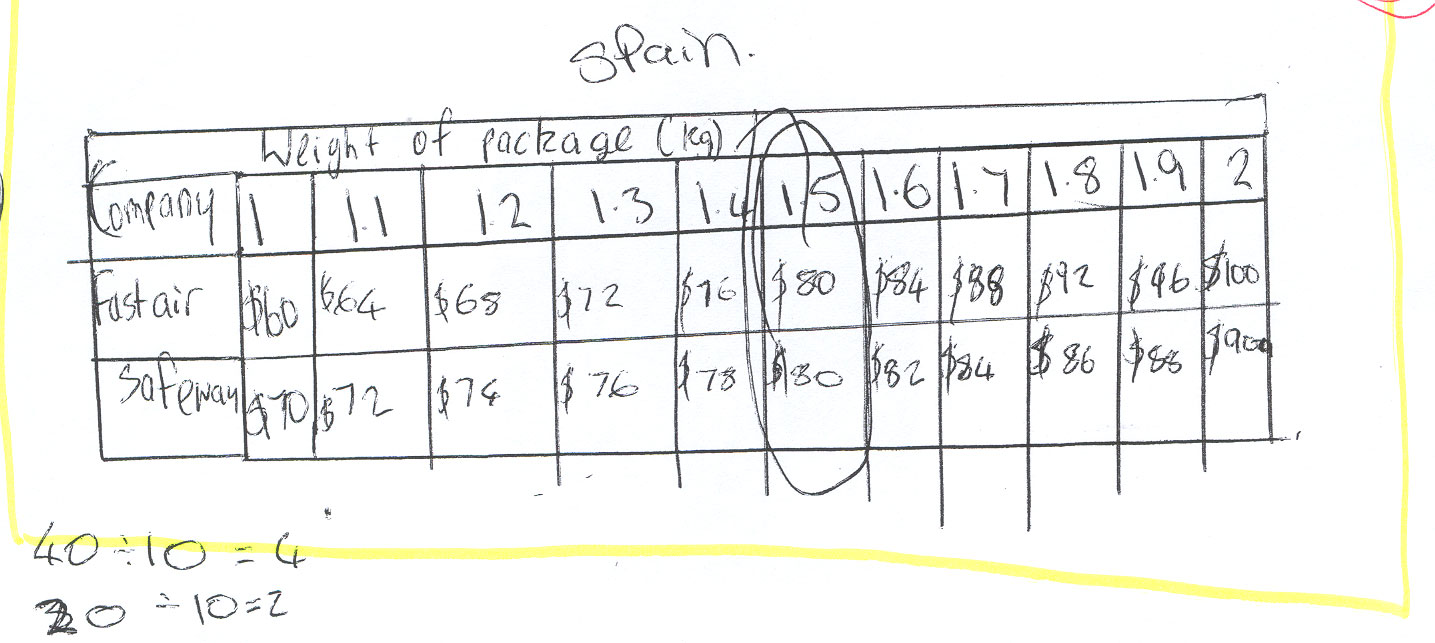
This table shows the price each company charges for sending a parcel to Tonga. Weights that are part kilograms are charged proportionally (e.g., each 0.1 kg will cost an extra $4 with FastAir).
Company Weight of parcel (in kilograms)
0 1 2 3 4 5
FastAir $20 $60 $100 $140 $180 $220
SafeWay $50 $70 $90 $110 $130 $150
 
Show how to use this table to find the weight of a parcel that both companies would charge the same amount of money to send to Tonga (give your answer to 1 d.p).


Weight of parcel: __________ kilograms


c)
These equations show the price each company charges for sending a parcel to Tāmaki Makaurau.
 
          FastAir:           Cost = 7x + 14
          SafeWay:        Cost = 4x + 35
          where x is the weight of a parcel.
 
Show how to use these equations to find the weight of a parcel that both companies would charge the same amount of money to send to Tāmaki Makaurau.


Weight of parcel: __________ kilograms

Task administration: 
This task is completed with pencil and paper only.
Level:
5
Description of task: 
Students use tables, graphs, and equations to find the break-even point for two companies who charge for postage according to different rules.
Curriculum Links: 
Key competencies
This resource involves showing how to solve two simple linear equations simultaneously using graphs, tables, and equations. This relates to the Key Competency: Using language, symbols and text.
Learning Progression Frameworks
This resource can provide evidence of learning associated with within the Mathematics Learning Progressions Frameworks.
Read more about the Learning Progressions Frameworks.
Answers/responses: 
  Y10 (05/2007)
a)

Graphical method or a written explanation that shows the weight is between
2 & 2.5 kg.
2.4 [Accept 2.25 to 2.49 kg]

easy
 
moderate

b)

Tabular method that shows the weight is half way between 1 & 2 kg.
1.5

very difficult
very difficult

c)

Uses equations appropriately to formulate the problem
     i.e.,  7x + 14 = 4x + 35
Uses formulation or a trial and improvement method.
7

very difficult

difficult
very difficult

Based on a representative sample of 147 students.
NOTE: Students who used algebraic formulation in part c) had a higher mean ability than those using trial and improvement.
Diagnostic and formative information: 
  Common response Likely misconception
a) 2.5 Does not see that the intersection of the two lines is closer to 2 than to 3, i.e. it must be less than 2.5.
b) 2 (or 1) Selects a whole-kilogram weight from the table where the two companies charge the most similar amounts.

Teaching suggestions

  1. This resource emphasises three different ways algebraic relationships can be described – graphically, in a table, or as an equation. Students should be encouraged to use each of these three representations and see the links they have with each other. Moving between these  representations can be sped up by appropriate use of technology. This use of multiple representations in mathematics fits well with the Key Competency of Using language, symbols, and text, and has many of the features that are referred to in the 2007 curriculum document. See Figure it out resources Digital dilemmas (Number Sense and algebraic Thinking, L3, Book 2, pages 16-17) and Changing Tyres (Algebra, L4, Book 2, page 24) for multiple representations.
  2. Students could be encouraged to share their strategies in pairs, small groups or with the whole class. Discussion could be centred on which strategies are more successful or more efficient. For further information refer to Assessment Strategies: Mathematical classroom discourse.


Student strategies
Students used a variety of strategies to solve each of the questions. These are listed below with links to examples of student work. Percentages of students using each strategy are indicated in brackets.

Graphical interpretation [part a)]

  1. Indicating the x- and the y- coordinates of the intersection of the lines (5%).
  2. Indicating the x-coordinate only of the intersection of the lines (35%).
  3. Indicating the intersection of the lines only (26%).
  4. Using graphical interpolation to get a more accurate answer (19%). This was often used in conjunction with one of the other three strategies. About 80% of students who showed interpolation obtained a correct answer, while only about 50% of those whose working did not show interpolation got a correct answer. Many of the latter were satisfied with 2.5 as their answer, even though the break-even point was clearly somewhat less than that.

Table interpretation [part b)]

  1. Interpolation of the table between 1 and 2 kg (4%).
  2. Using the differences between 1 and 2 kg for the two companies (9%).
  3. Averaging the costs at 1 and 2 kg (1%).

Using equations [part c)]

  1. Algebraic formulation of the problem (9%).
  2. Trial and improvement methods (15%). The included a range of methods including moving sequentially towards the solution in single integers, to jumping several numbers to speed up getting to the answer. 

About 60% of the students who used algebraic formulation or trial and improvement, successfully obtained the correct answer. If the answer was not a small whole number those that used algebraic formulation may have been more successful.

Next steps: 
Graphical interpretation:

  • •  Students should be encouraged to indicate not only where the two lines meet, but also should show a vertical line to the x-axis. This encourages more accurate estimates of the weight (x).
  • •  Showing a horizontal line to the y-axis should also be encouraged, as this most often allows more accurate estimates of the cost (y) where the two lines meet.
  • •  Students should indicate graphical interpolation such as smaller tick marks to improve accuracy.

Table interpolation:

  • •  This requires the student to apply proportional reasoning strategies.

Using equations:

  • •  Students should be encouraged to use algebraic formulation as a way to represent this type of problem, even if they are not fully ready to solve the equation.
  • •  Students who attempt to solve the equations can self-assess their answer by substituting their results into the initial equation(s) to see if they are equal.
  • •  Students need to apply more sophisticated trial and improvement strategies. Click on the link for a breakdown of these. Encourage discussion with students about how they selected their first "trial" number, and how they then choose and checked subsequent estimates.

Other resources
For other ARB resources click on the link or use the keyword breakeven points.

Exemplars of progression in student strategies
Numbers give an approximate idea of the progressions in the sophistication of strategies being used.

Graphical interpretation
1.  Indicating the intersection of the lines only

2.  Indicating the x-coordinate only of the intersection of the lines.

3.  Indicating the x- and the y- coordinates of the intersection of the lines.

4.  Graphical interpolation This can be used in conjunction with any of the first three


Table interpretation
1.  Interpolation of the table

2.  Using the differences between 1 and 2 kg for the two companies.

3.  Averaging


Using equations
1.  Algebraic formulation of the problem
1.1  Formulation only

1.2  Formulation and an unsuccessful attempt at solution (This often uncovers other algebraic misunderstandings).

1.3  Formulation and a successful solution.


2.  Trial and improvement These are in an increasing order of sophistication.
2.1  Initial guess then no iteration.

2.2  Initial guess followed by another guess (i.e. no trial and improvement, just trial and error).

2.3  Correct initial guess.

2.4  Starting from 1 and iterating in steps of 1

2.5  Initial guess then iterating with a step size of 1.

2.6  Jumping to the solution. This may take on highly sophisticated forms in more difficult problems that may be of greater complexity than the algebraic formulation.