Savings account

Savings account

Pencil and paper
Overview
Using this Resource
Connecting to the Curriculum
Marking Student Responses
Further Resources
This task is about interpreting a line graph.
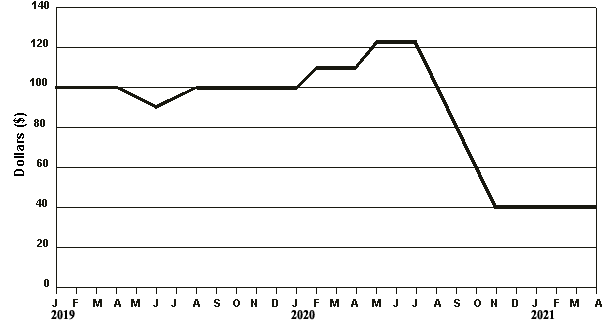
This graph shows the number of dollars Sam had in his account from January 2019 to April 2021.


Sam's Savings Account

graph of savings

 
a)

 
How many dollars did Sam have in his account in December 2019? $__________


b)

In which month in 2020 did he have $80 in his account? ____________________


c)

Draw a circle around the part of the graph that shows when Sam was taking the most money out of his bank account.


d)

What does the flat graph line between November 2020 and April 2021 tell you?


Task administration: 
This task is completed with pencil and paper only.
Levels:
4, 5
Description of task: 
Students interpret a line graph showing the amount of money in a savings account over time. No calculation is required.
Learning Progression Frameworks
This resource can provide evidence of learning associated with within the Mathematics Learning Progressions Frameworks.
Read more about the Learning Progressions Frameworks.
Answers/responses: 


Y8 (03/2000)

a) 100 very easy
b) September [Accept Sept or S]. very easy
c) Circles all or part of the graph line between July 2020 and November 2020. moderate
d)

Any 1 of:

  • He didn't take any money out.
  • He didn't bank any money.
  • He didn't make any transactions.
  • His account balance stayed the same.
  • He took out as much money as he put in.

[Accept similar ideas with different wordings.]

moderate