Lake Chad

Lake Chad

Pencil and paper
Overview
Using this Resource
Connecting to the Curriculum
Marking Student Responses
Further Resources
This task is about reading and interpreting information from graphs.


Figure A shows changing levels of Lake Chad, in Saharan North Africa. Lake Chad disappeared completely in about 20000 BC, during the last Ice Age. In about 11000 BC it reappeared. Today, its level is about the same as it was in AD 1000.

Figure A
Lake Chad: changing levels
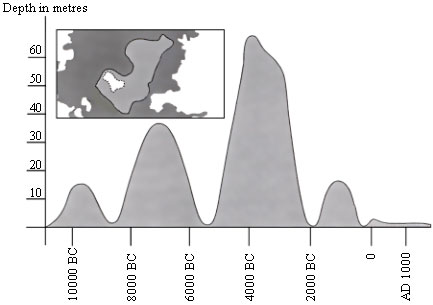
 

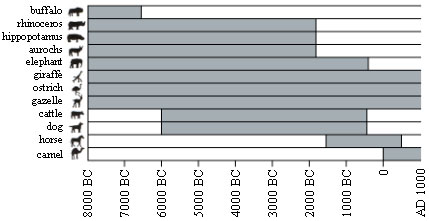
Figure B shows Saharan rock art (ancient drawings or paintings found on the walls of caves) and changing patterns of wildlife.

Figure B
Saharan rock art and changing patterns of wildlife

Source: Copyright Bartholomew Ltd, 1988. 'The Times Atlas of Archaeology', Harper Collins Publishers.


1. What is the depth of Lake Chad today?

(A) About two metres.
(B) About fifteen metres.
(C) About fifty metres.
(D) It has disappeared completely.
(E) The information is not provided.

2. In about which year does the graph in Figure A start? ____________

3. Why has the author chosen to start the graph at this point?


4. Figure B is based on the assumption that:
 
(A) the animals in the rock art were present in the area at the time they were drawn.
(B) the artists who drew the animals were highly skilled.
(C) the artists who drew the animals were able to travel widely.
(D) there was no attempt to domesticate the animals which were depicted in the rock art.
 
5. For this question you need to draw together information from Figure A and Figure B. The disappearance of the rhinoceros, hippopotamus, and aurochs from Saharan rock art happened:
 
(A) at the beginning of the most recent Ice Age.
(B) in the middle of the period when Lake Chad was at its highest level.
(C) after the level of Lake Chad had been falling for over a thousand years.
(D) at the beginning of an uninterrupted dry period.
Task administration: 
This task can be completed with pencil and paper.
Level:
5
Description of task: 
Students study two graphs on some rocks and lake features of Saharan North Africa and answer a mix of questions to show this ability to interpret these graphs.
Answers/responses: 
    Age 15 (09/2000)
1. A 67%
2. Answers which state 11000 BC (or an approximation between 10500 and 12000), indicating that the student has extrapolated from the scale). For example:

  • 11000.
  • 11000 BC.
  • 10500 BC.
  • Just before 10000 BC.
  • About 12000.
  • About 11000 BC.
61%
3. Answers which refer to the reappearance of the lake. NOTE: an answer may receive score 1 even if the previous answer is incorrect. For example:

  • Lake Chad reappeared in 11000 BC after disappearing completely around 20000 BC.
  • The lake disappeared during the Ice Age and then came back at about this time.
  • It reappeared then.
  • About 11000 BC it came back.
  • Then the lake reappeared after being gone for 9000 years.
36%
4. A 78%
5. C 59%

NOTE: © OECD (2002). Reproduced with permission of the OECD.