Sentence lengths II

Sentence lengths II

Pencil and paper
Overview
Using this Resource
Connecting to the Curriculum
Marking Student Responses
Working with Students
Further Resources
This task is about statistical investigations.

Do you think picture books or chapter books usually have fewer words in their sentences?

Part I - Individual work
 
a) i)
Which type of book do you predict will have longer sentences overall?
 
   
(A) Picture books
(B) Chapter books
(C) Both types of books will have sentences with similar numbers of words in them.
 
  ii) Explain your prediction.
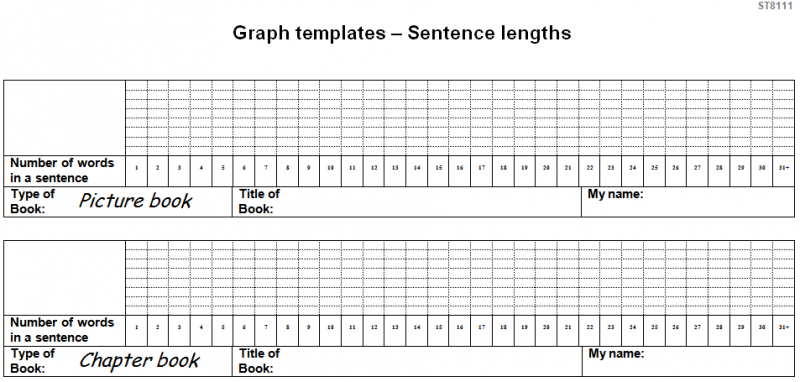


b) i) Select one picture book and one chapter book.
  ii) For each book, count the number of words in 40 consecutive sentences.
  iii) Record the number of words in each sentence on the graph provided.
 
iv)
 
Use a separate graph for each type of book.
 
c) i)
Which of your two books had sentences that were usually longer?

My picture book / My chapter book / Both had sentences about the same length (circle one)

 
  ii) Use your two graphs to explain why you circled that option.


Part II - Group work

  1. Cut out each of your two graphs.
  2. Attach each of them to the piece of paper that is labelled with the type of book it is.
  3. Place the graphs directly under any graphs already on that piece of paper. Your two graphs should be on separate pieces of paper.
  4. Look at one of the sets of graphs as a group, then answer d) individually.
  5. Look at both of the sets of graphs as a group, then answer e) individually.
d) i)
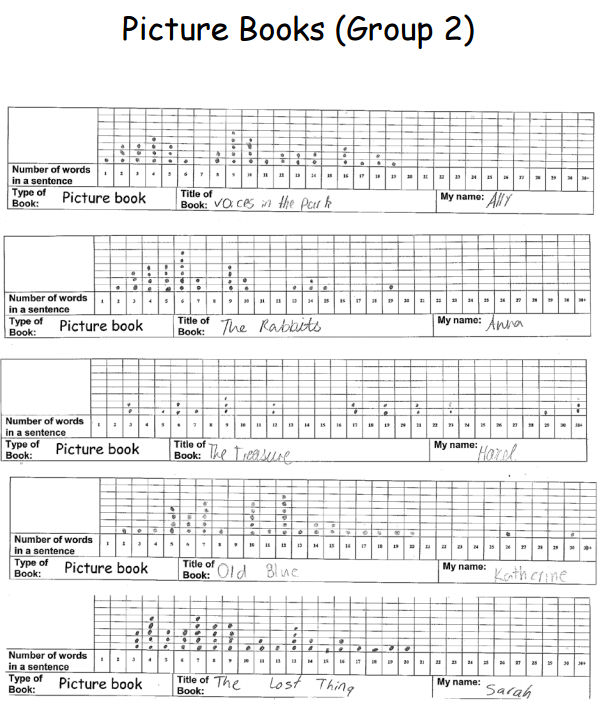
Look at all the graphs of picture books that your group made. 
Did the picture books have similar patterns of sentence lengths as each other? Yes / No     (circle one)  
  ii) Use your group’s graphs of picture books to explain why you circled that option.


e)
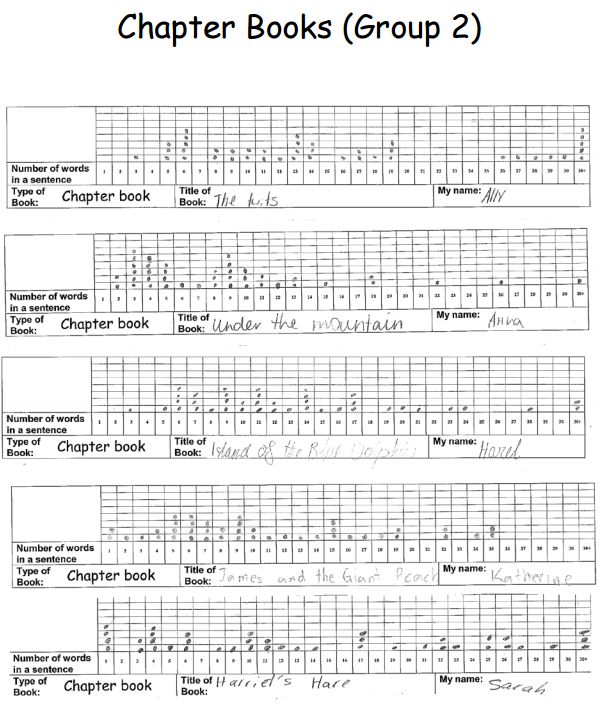
How do your group’s graphs of sentence lengths of picture books compare with your graphs of chapter books?


Part III - Group work

Task administration: 
This task requires physical space for students to move around and equipment.
 
Equipment:
Two pieces of A3 paper per group.
 
Before you start:
  • Ensure students know how to record on a dot plot. Model this to the class.
  • You or your students may wish to use categories of books other than chapter or picture books.
  • You may wish to have some novels aimed at younger or older students; non-fiction books; junior school readers etc.
  • Make the relevant changes in the word version. [Cut and paste student task into word processing program. See Changing an assessment resource.].
  • If you do select different types of books, then:

    • Divide the class into groups of at least four, and preferably five or six.
    • Each group should select the two genre of books that their group will study. They should change their worksheets by writing the genre they are studying.
    • Once they have decided, then they should do Part I individually.
Moving to Part II – Group work
  • This could be done as part of a separate session.
  • The students return to their original groups and make posters of their graphs using two sheets of A3 paper.
  • For question d) the group members look at and discuss all their graphs on one of their posters (e.g., picture books). They then individually complete question d).
picture-books-G2.png
 
For question e) each group talk about and compare their two sets of graphs (e.g., picture books and
chapter books), and then individually complete question e)
 
chapter-books-G2.png   picture-books-G2.png
Two displays made by Group 2. This group compared the five chapter books for question d). 
 
Further work – Group and whole class
These activities could then be done:
  • Each group could then write up their group’s conclusions and display their posters.
  • Students could then look at the findings of the different groups.
  • The class could then discuss some findings over all the groups.
Level:
3
Description of task: 
Students conduct a statistical investigation into the sentence length of different types of books by making and comparing dot plots.
Curriculum Links: 
This task helps to identify students understanding about:
 
Collecting data: Evidence of students’ ability to record data accurately.
Look for plotting all data points correctly for both graphs and annotating the graph.
 
Analysing and making conclusions: Evidence of students’ ability to compare the distribution of different sets of data.
Look for consistently identifying that several distributions are reasonably similar or very different, and giving an explanation based on the overall shape of the graphs.
 
Key competencies
This resource involves:

  • Predicting the outcome of an experiment, exploring patterns and relationships in data and dealing with uncertainty, which relate to the Key Competency: Thinking
  • Communicating the findings of an experiment, and explaining  variation, which relates to the Key Competency:Using language, symbols and text
  • Working collaboratively and sharing their work with other students, which relates to the Key Competencies: Relating to Others and Participating and Contributing

 For more information see http://nzcurriculum.tki.org.nz/Key-competencies

Learning Progression Frameworks
This resource can provide evidence of learning associated with within the Mathematics Learning Progressions Frameworks.
Read more about the Learning Progressions Frameworks.
Answers/responses: 
     
a)
i)
 
ii)
 
Circles an appropriate option [Accept unless there are very clear differences that they do not notice, or if the two are very similar and they conclude that they are different.]
Any reasonable explanation consistent with a) i)
Examples:
Picture Books will have shorter sentences.

  • Because they are made for younger children that aren’t that good at reading.
  • Often picture books are made for little kids learning to read so often the sentences are short and to the point whereas chapter books you need more imagery so sentences are deeper and bigger.
  • Because it is usually written for a younger audience.
  • It makes reading aloud easier.

They will both be about the same.

  • Because no matter what size the book is, it will still be the same.
  • Because being a chapter book doesn’t change anything.
  • Because they’re both just books that are aimed at different ages.

Picture Books will have longer sentences.

  • Because kids need to read chapter books to themselves, but grown-ups read picture books to them. 
b)
i)
ii)-iii)
iv)
Selects two appropriate books.
Records 40 dots on each graph.
Annotates each graph.
c)
i) 
 
ii)
Circles an appropriate option [Accept unless there are very clear differences that they do not notice, or if the two are very similar and they conclude that they are different.]
Explanation using a reasonable comparison based on the overall shape (distribution) of both their dot plots. 
This will depend on the patterns of the two graphs that they have produced. Click on student work samples to see a discussion of students’ comparing their own two graphs [pdf].
Look for statements about:
 
The location of the dots on the two graphs
  • The two [graphs] were very unbalanced, one mostly high, the other mostly low.
  • Neither. Both books had a lot of sentences with 12 words or under, and they both have a few sentences with more than 13 words.
The variation (spread) of the dots (often about the “tail” of longer sentences)
  • It [the chapter book] had a bigger variety of sentences so it had longer sentences.
  • Because in [the chapter book] the sentences only got as big as 20, while [in the picture book] lots of the sentences went over 20 [words].
  • Because [some sentences] were over 30 words in the chapter books and in the picture book it didn’t go over 19
d)
i)
ii)
Reasonable comparisons made and 
Uses the shapes (distribution) of the different graphs in their group relating to the same genre of book to make a reasonable conclusion.
This will depend on the patterns of the graphs that the group have produced for this genre of book. Click on student work samples to see the posters of the two groups [pdf].
Look for statements about:
The location of the dots
  • Yes. Most of the book’s length in sentences were in the bottom half on the chart.
  • Yes. The majority of graphs showed more low sentences.
  • Yes – because the majority of the sentence lengths were 1-15 words.
  • Yes – Most of the books have sentences mostly between 7-17 [words].
The variation (spread) of the dots
  • Yes – It was similar because most of the chapter books had [quite a few] longer
  • sentences and only a few had mostly shorter sentences.
NOTE: Students who can state which graphs are similar and which vary display a more
sophisticated ability to discriminate between distributions of data. No students in the
sample did this.
 
Teaching and learning: 
This resource is about:
  1. Students’ ability to record data accurately [part c)] and to devise ways to record data [parts e) and f)]. Take account of student’s contributions to the group's work.
  2. Giving data-based explanations.
  3. The distribution of graphs. This is the overall shape of the graph (e.g., where most of the data is) rather that individual features. Look for responses which note general features of the graph, especially ones about:

    1. The location of the data, i.e. where “the biggest chunk” of the data lies, or
    2. The variation (spread) of the data. Often they comment on the right-hand “tail” of longer sentences in chapter books.
Students may give different responses for parts c), d), and e). These ask increasingly more complex comparisons. This tends to move the student away from detailed comparisons towards more general, holistic ones.
Diagnostic and formative information: 
  Student response
a) ii) Refers to variables that are unrelated
Students state a relationship between two variables that have no clear link.
Examples:

  • Because picture books are usually smaller than chapter books so the sentences will be shorter as well.
  • Because picture books have pictures in them, so there isn’t much space for longer sentences.
c) States a reason for the sentences being shorter that is not related to their data
Students often give a reason why chapter books may have longer sentences without referring to the data. This is often a justification for, or a repetition of their prediction rather than a data-based finding. It may also be a subjective reaction to the text.
Examples:

  • [Chapter books] had longer and more sophisticated sentences than picture books.
  • The chapter books had longer sentences as chapter books are meant for older kids meaning that it will have more adjectives, verbs, nouns and adverbs.
c)-e) Focuses on individual features (e.g., mode, maximum)
These students focus on individual features of the graphs, including the category with the most data point (i.e., the mode).
Examples:

  • Chapter books because most were over 30 and in the picture book it didn’t go over 19.
  • YES – because they all had at least one [sentence] of 30 or more words
Next steps: 
Refers to variables that are unrelated
Students relate variables when there is no clear link (e.g., picture books are shorter and therefore have shorter sentences). Get these students to explain their ideas to a peer, or to the group they are working in. The next step is for them to see if the data supports their prediction. Even if it does, it does not necessarily imply that the stated reason is valid.

States a reason for the sentences being shorter that is not related to their data
These students often repeat their assumptions about sentence length. They need to give an explanation based on the data from their two graphs. Point out that c) ii) asks for this. They could then attempt part c) ii) again. Their experiences with answering d) and e) may have prepared them for data-based explanations.

Focuses on individual features (e.g., mode, maximum)
Encourage these students to look at a graph as a whole rather than discussing individual features. One way to do this is to ask the students to put a circle around most of their points. Their circle should include at least half of the points, and preferably two-thirds or more. Students who look at the mode rather than the “biggest clump” of the data need to see that the location of most of the data is a different than finding the most common category [the mode].” Students could be asked to describe their graphs again after circling where most points lie.
Figure it out
For resources that look at the distribution (shape) of graphs visually:
  • Population pyramid (Statistics, Book 2 L4, p.10); and
  • Uniform changes (Statistics, L3–4, p.2), particularly the first graph.