Ice cream and temperatures
0
Overview
Using this Resource
Connecting to the Curriculum
Marking Student Responses
Working with Students
Further Resources
This task is about reading the main idea of a graph.
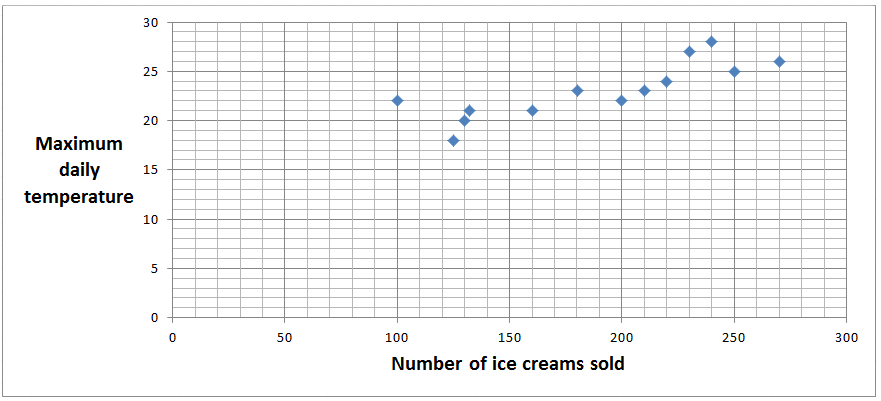
This graph shows the number of ice creams sold and the maximum daily temperature on different days.
The number of ice creams sold and the maximum daily temperature

Task administration:
This task can be completed with pencil and paper or online (with auto marking).
Levels:
3, 4
Curriculum info:
Key Competencies:
Keywords:
Description of task:
Students interpret a scatterplot and identify statements about both details and overall information.
Curriculum Links:
This resource can help to identify students' understanding of identifying a correct statement about a data display.
Learning Progression Frameworks
This resource can provide evidence of learning associated with within the Mathematics Learning Progressions Frameworks.
Read more about the Learning Progressions Frameworks.Answers/responses:
| Y6 (03/2016) | ||
| a) |
 |
moderate |
| b) |
 |
Both correct - difficult
1+ correct - moderate |
| c) |
 |
Both correct - difficult
1+ correct - moderate
|
Teaching and learning:
This resource is about interpreting a graph to identify overall or general statement about the data from a selection of distractors that include two statements that have specific correct details, two incorrect overall statements, and one correct overall statement.
Diagnostic and formative information:
| Common error | Likely misconception | Next steps |
|
a) "250 ice creams were sold on a day when the temperature was 25ºC".
|
Selecting specific details rather than an overall statement
This is a true statement about specific details on the graph, but it is not the "best overall statement" about the graph.
|
This idea of the difference between an overall statement and a specific detail about the graph is a key understanding for students to develop in interpreting graphs. By differentiating overall statements from details statements students can start to recognise what constitues a general statement. Students could also be asked to make up their own statements about data on a graph: both overall and details. |
| a) "More ice creams were sold on cooler days". |
Incorrect overall statement selected
Students who selected this incorrect overall statement may be connecting the words "cooler" and "ice cream", and accepting this as true without deconstructing what the statement actually means.
|
Students could be asked to check their work, and to think about whether the statement is true. It is an overall statement, which means that perhaps students can differentiate it from details. Students need t conside what "cooler days" means and show this on the graph to confirm the statement is true. |
| a) "The temperature does not affect the number of ice creams sold". | Students who selected this incorrect overall statement may have read this graph as essentially a straight flat line, a cluster of random plots with no relationship, or did not recognise the increase of the data (line of best fit). | Students may need to have the opportunity to describe what they see the data doing, and use a ruler and/or draw a line of best fit on a printed graph. |
| b) "130 ice creams were sold on a day when the temperature was 20ºC". |
Difficulty reading the scale on the axis
Students read this true detail as not true. They may have difficulty confirming this specific detail on the graph, as the marks on the x-axis are only labelled going up in 50s, so students need to recognise that each mark (or line) is 10 more ice creams to figure out the location of 130 ice creams on the x-axis.
|
Students may need some further support with reading measurement scales, and finding out how to read labelled marks, the unlabelled marks, and (eventually) some measures between unlabelled marks. The resources Reading scales and Reading scales II look at reading marks between labelled marks. The resource Sea shells requires students to read data on a bar graph with unlabelled marks. Skyrocket involves reading details from fully labelled axes. |
| b) and c) - Select only one option. |
Students only selected one option for questions b) and c).
|
Students who only selected one option for questions b) and c) could be asked to check their work to confirm that their single answer was correct. They could then identify one more statement that was "not true" (b) or "about details on the graph" (c). |

