Talking about graphs

Talking about graphs

Auto-markingPencil and paperOnline interactive
Overview
Using this Resource
Connecting to the Curriculum
Marking Student Responses
Working with Students
Further Resources
This task is about information in graphs.
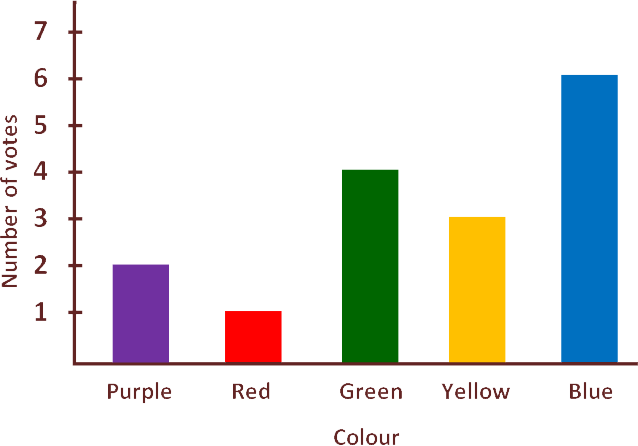
Mataī Hub's favourite colours
matai hub's favourite colours
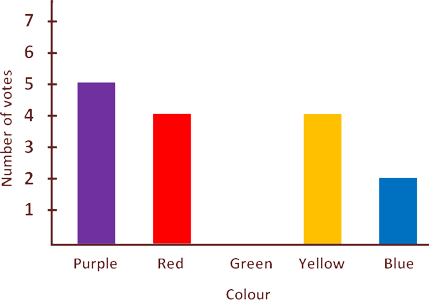
Kauri Hub's favourite colours
kauri hub's favourite colours
Students in the Mataī and Kauri Hubs voted for their favourite colour.
These graphs show how each Hub voted.

Question

a)  Aroha says,
Aroha saying "The colour blue has the most votes in this hub"
Select the graph which shows this.
    • Mataī Hub's favourite colours
      matai hub's favourite colours

    • Kauri Hub's favourite colours
      kauri hub's favourite colours

Question

b)  Nick says,
Nick saying "Red and yellow got the same number of votes in this hub"
Select the graph which shows this.
    • Mataī Hub's favourite colours
      matai hub's favourite colours

    • Kauri Hub's favourite colours
      kauri hub's favourite colours

Question

 c)  Evie says,
Evie saying "The colour green gor not votes in this hub"
 
Select the graph which shows this.
    • Mataī Hub's favourite colours
      matai hub's favourite colours

    • Kauri Hub's favourite colours
      kauri hub's favourite colours

Question

d)  Eli says,
Eli saying "Most people voted green or blue in this hub"
Select the graph which shows this.
    • Mataī Hub's favourite colours
      matai hub's favourite colours

    • Kauri Hub's favourite colours
      kauri hub's favourite colours

Task administration: 
This task can be completed online or with pencil and paper. If completed online, auto-marking will be displayed to students.
 
This task can be completed by individuals, in pairs, small groups, or as a whole class.  
 
If students work in pairs, they can share their findings with other pairs of students and discuss their reasons for selection before sharing with the wider group.
 
It may help to model how to carry out this task by completing the first question as a class or group.
Levels:
1, 2
Description of task: 
Students select which graph matches a given statement.
Learning Progression Frameworks
This resource can provide evidence of learning associated with within the Mathematics Learning Progressions Frameworks.
Read more about the Learning Progressions Frameworks.
Answers/responses: 
  
 
    Y2/3 (04/2018)
a)
                  Mataī Hub's favourite colours

matai hub's favourite colours

very easy
b)
             Kauri Hub's favourite colours

kauri hub's favourite colours

easy
c)
             Kauri Hub's favourite colours

kauri hub's favourite colours

easy
d)
                  Mataī Hub's favourite colours

matai hub's favourite colours

easy
Based on an online sample of Year 2 and 3 students
Teaching and learning: 
This resource is about statistical literacy: being able to interpret statements that others have made about a graph.
 
Students need to have some familiarity with simple bar graphs and an understanding of concepts such as mostleast, the same as, none
 
 
Next steps: 
For students who selected incorrect graphs, ask them to explain the reason for their selection.
 
For students who had difficulty interpreting the graphs, or who selected incorrect graphs, further exposure to bar graphs may be needed as well as modelling of how to 'read' the bars.  Part of this is about learning which parts of the graph to pay attention to, e.g., understanding that to work out how many people prefer the colour blue, they need to look at the top of the blue bar and 'read' across to the number on the y-axis.
 
For students who were able to complete the task,  have them make their own statements about the graphs in this resource, or other simple bar graphs.
 
Students could also construct their own bar graphs (about favourite colours, ice cream flavours, pets, etc.) and make statements about their graphs.   Initially these could be for one group of students, then graphs from two (or more) different groups (based on classes, hubs, houses or gender) could be created and used to match statements to graphs, e.g., "Students in this room like chocolate ice cream the most." or "No one in this group likes rabbits for pets."
 
The NZMaths resource, Match ups, takes students through a process from creating a class pictograph to selecting the graph that best shows a statement.
The NZMaths resource Match ups has a selection of graphs that can be used to generate statements and to match statements to graphs.
 
The following are Level 1 and 2 resources on statistical literacy and statistical investigations: