Tamariki ages
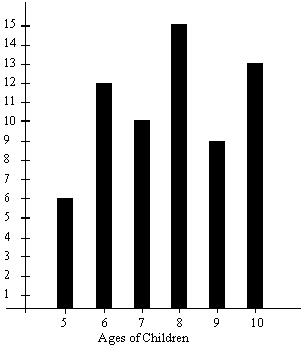
This task is about interpreting a bar graph.
|
Susan and Marie wanted to find out the ages of all the children at Ormond School.
This is what they found out:
|
|||||||||||||||||||
|
|||||||||||||||||||
|
a) |
Put this information on the graph below.
The first bar has been done for you.
|
||||||||||||||||||
|
Ages of Children at Ormond School 
|
|||||||||||||||||||
| b) |
What is the most common age of the children at Ormond School? __________
|
||||||||||||||||||
| c) | Altogether how many children are either 5 or 6 years old? __________ | ||||||||||||||||||


