Monthly rainfall

Monthly rainfall

Pencil and paper
Overview
Using this Resource
Connecting to the Curriculum
Marking Student Responses
Working with Students
Further Resources
This task is about reading information from a bar graph.
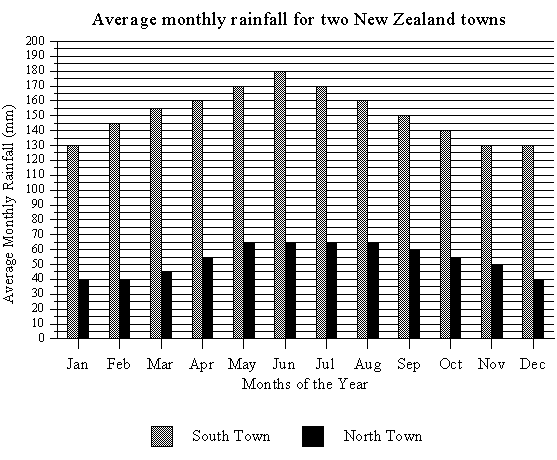
rainfall bar graph


a)
What is the total yearly rainfall for South Town? __________ mm
 
b)
What is the total yearly rainfall for North Town? __________ mm
 
c)
What is the mean monthly rainfall (to 2 decimal places) for South Town? __________ mm
 
d)
What is the mean monthly rainfall (to 2 decimal places) for North Town?
 
__________ mm
 
e)
What is the range of rainfall in
 
  i)  North Town? __________ mm
 
ii) South Town? __________ mm
Task administration: 
This task is completed with pencil and paper only.
Level:
4
Description of task: 
Students answer questions and calculate means and ranges from a composite histogram of rainfall in two towns.
Curriculum Links: 
This resource can be used to help to identify students' ability to interpret a bar graph, including measures cetrality and spread.
Learning Progression Frameworks
This resource can provide evidence of learning associated with within the Mathematics Learning Progressions Frameworks.
Read more about the Learning Progressions Frameworks.
Answers/responses: 
 

Y8 (11/1997)

a)    1820 moderate
b)    645 moderate
c)    151.67 [accept if = answer to a) ÷ 12] difficult
d)    53.75 [accept if = answer to b) ÷ 12] difficult
e) i)
ii)
25 [accept 40-65]
50 [accept 130-180]
NOTE: The later definition of range (i.e., 40-65) is now in less common usage.
moderate
difficult


Diagnostic and formative information: 
   Common error Likely reason

c)

1/10 answer to a) Divide by 10 instead of 12 to get monthly average.
d) 1/10 answer to b)
e)i)
   ii)
65
180
Confuses maximum with range.
e)i)
   ii)
40
130
Confuses minimum with range.