Who is using what social media
This task is about interpreting data from a bar graph.
Age of people who use social media
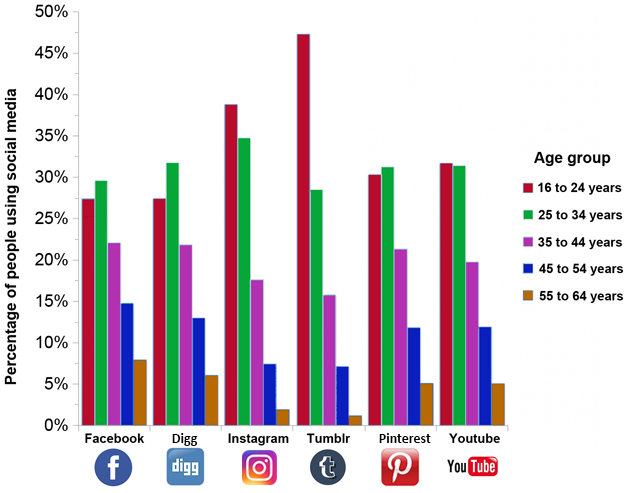
A survey was done to find out what social media applications different age groups used. The results are shown on a graph above.
Use this graph to answer the following questions.