Colours of cars II

Colours of cars II

Pencil and paper
Overview
Using this Resource
Connecting to the Curriculum
Marking Student Responses
Working with Students
Further Resources
This task is about creating and then reading information from a bar graph.

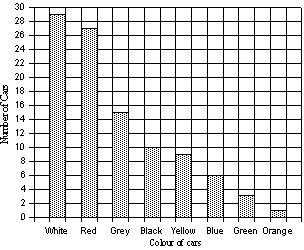
Alex watched 100 cars go past his gate and wrote down how many cars of each colour went by.

This is what he found.  

White – 29 Yellow – 9
Red – 27 Blue – 6
Grey – 15 Green – 3
Black – 10 Orange – 1
 a)
 Complete the bar graph below to show Alex's results.
Remember to label both axes.
 
 
Colour of cars passing Alex's gate
 
 
b) If all the cars were lined up in the order of their colour (the order shown in the bar graph above), with all the white cars first, all the red cars second, all the grey cars third, and so on, what would be the colour of ...
 
 i) the 25th car? ____________________
 
ii) the 50th car? ____________________
 
iii) the 75th car? ____________________
Task administration: 
This task can be completed with pencil and paper.
Level:
3
Description of task: 
Students construct and label a bar graph of the colour of passing cars from data in a table and answer questions interpreting the results.
Answers/responses: 
  

Y6 (06/1998)

a)
For all bars drawn with correct height. 
For x and y axes labelled appropriately.
Colour of cars passing Alex's gate
very easy
very difficult 
b)
White
Red
Black
difficult

NOTE: Accept if students have drawn a histogram (i.e., bars on the graph have no spaces in between them), even though the data is discrete.

Diagnostic and formative information: 
  Common error Likely reason
a) Missing labels on axes. Axes labelled 'x' and 'y'.  
b) white, red, greywhite, black, orange Lists first 3 categories of colour.Cycles around the 8 colours in turn (i.e., 8th car is orange, 9th car is white).